
All-in-one platform for market education

Your Official Learning Hub on Trading,
Investing, and Personal Finance

Learn about Stock Market

Learn about Crypto Trading

Learn about Forex Trading

Learn about Mutual Funds and UITF investments

Learn about Business and Entrepreneurship


Unlock the full power of Investagrams
Please enter your first name.
First Name - Special characters and Numbers are not allowed.
First Name must be at least 2 characters.
Please enter your last name.
Last Name - Special characters and Numbers are not allowed.
Last Name must be at least 2 characters.
Please enter an email address.
Please enter a valid email address.
Please enter a password.
Password must be at least 6 characters.
By signing up, you agree to our Terms of Use and Privacy Policy .
DFNN, Inc.
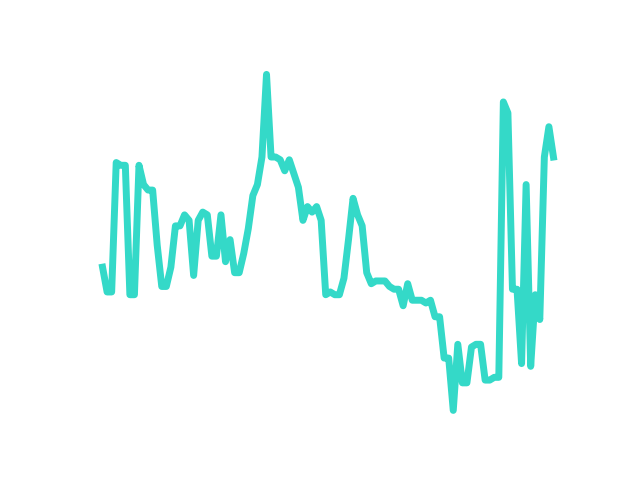
Philippines | Open | Prev. Close | Volume | Div Yield | P/E Ratio | Net Foreign | Market Cap |
|---|---|---|---|---|---|---|
| 3.00 | 3.11 | ₱30.00K 10.00K shares | 0% | -1.73 | ₱-30.00K | 1.15B |


An RSI between 50 to 70 signals that prices have been strong recently.
An ADX reading below 25 suggests that there is no trend - prices are just moving sideways.
A strong uptrend is present.
DFNN, Inc. (DFNN), formerly known as Diversified Financial Network, Inc., was incorporated on June 14, 1999 as an IT solutions provider and systems integrator. An integral part of the Company's services is to help companies integrate technology, processes and people while they focus on their core business and their customers. The industry classification for this type of business is defined as Business Process Outsourcing (BPO). The Company's services are divided into systems integration, programming and customization, consultancy, and gaming development.DFNN provides proprietary corporate solutions designed to maximize its client's existing computer infrastructure, which can be integrated with various front and back office systems that cater mainly to financial institutions. The Company also continues to develop various interactive mobile, wide area network and wireless solutions for business operations requiring effective and 24x7 reliable operations. DFNN also develops and enhances advances with technology to include other wireless technologies such as General Packet Radio Service, Wireless Fidelity, WiMAX and Nth Generation Wireless protocols.As of December 31, 2021, DFNN's subsidiaries are Inter-active Entertainment Solutions Technologies, Inc.; PGI Systems PTE Ltd.; Nico Bayan, Inc.; and Lucky U, Inc. DFNN also has a 49.36% stake in iWave, Inc.Source: SEC Form 17-A (2021)
| Business Address | L2 - L5 14th Floor, Philippine Stock Exchange Tower, 5th Ave. cor. 28th St., BGC, Taguig City, Philippines |
| Email Address | cyrus@dfnn.com |
| Website | http://www.dfnn.com |
| Telephone Number | (02) 8396-5270 |
| Fax Number | 8818-0998 |
| TIME FRAME | VOLUME | % CHANGE | -100 | -50 | 0 | 50 | 100 |
|---|---|---|---|---|---|---|---|
| 1D | 10,000.00 | | |||||
| 3D | 65,666.67 | | |||||
| 7D | 50,714.29 | | |||||
| 30D | 80,033.33 | | |||||
| 50D | 131,960.00 | | |||||
| 100D | 146,260.00 | | |||||
| Indicator | Value | Gauge | Status |
|---|---|---|---|
| RSI (14) | 57.1498 | | Bullish |
| ADX | 21.9388 | | Weak Trend |
| MACD | 0.1137 | | Strong Upward Momentum |
| Candlestick (1 day) | White Marubozu | | bullish |
| Candlestick (2 days) | Bullish Harami | | bullish |
| Candlestick (3 days) | Three White Soldiers | | bullish |
| TOP NET BUYERS | VOLUME | SHARES | AVG PRICE |
|---|
| TOP NET SELLERS | VOLUME | SHARES | AVG PRICE |
|---|
History
Block Sales


Subscribe to Prime and win exclusive prizes


Join the Discussion
Make a forecast
$PSE:DFNN
read moreGusto itulak ah...wala nga lang gusto bumili...patamain mo ako sa lotto ng ibili ko ng share nyo...😂😂😂😅
$PSE:DFNN
read morehttps://www.philstar.com/business/2025/03/10/2427104/dfnn-poised-expansion
DFNN poised for expansion
DFNN Inc. is poised for expansion as it explores more partnership opportunities with the Philippine Charity Sweepstakes Office (PCSO), while also potentially venturing into new businesses through its collaboration with Spain's CIC Consulting Informático.
$PSE:LOTO , $PSE:DFNN
read moreGuys, will LottoMatik POS device kill traditional LOTTO outlets?
I mean , soon, your local sari store can sell you tickets from a relatively cheap device. Also, will DFNN sell the devices to PCSO or get a percentage of sales? Any info?
$PSE:PX $PSE:OGP $PSE:CPG $PSE:LTG $PSE:DFNN
read moreA visit to a vault of iron might,
Where secrets and riches rest in sight,
A leader strides with a grand design,
To alter the course, to realign.
The tides of wealth begin to rise,
But with it, a great divide defies,
The rich grow rich, the poor fall far,
While some are lost, like a fading star.
A world once whole now starts to fracture,
As some taste success, and others, rapture,
Yet those who falter, who cannot see,
Will be left adrift, denied the key.
The numbers climb, but hearts turn cold,
A future shaped by hands too bold,
The wealthy few, the vast unknown,
A tale of wealth that’s overthrown.
Let's welcome March by marching toward financial freedom! 🚶🚶♀️
read moreManood ng live education sessions tuwing Lunes hanggang Biyernes, from 6 PM to 10 PM, at matuto ng LIBRE! 🤩 This is your chance to level up your trading skills! 🙌
All set to level up! 💻📚
Join us here: https://bit.ly/XM-LiveEducation
#XMPhilippines $NYSE:V $PSE:LMG $PSE:DFNN $:WEB
$PSE:PSE $PSE:PSEI $PSE:DFNN The Philippine Charity Sweepstakes Office (PCSO) has partnered with DFNN Inc. in launching ‘LottoMatik,’ a handy, portable point-of-sale (PoS) device.
read moreRead: https://www.itechsolutionph.com/blog/pcso-partners-with-dfnn-in-launching-lottomatik
PCSO Partners with DFNN in Launching 'LottoMatik'
To increase lotto sales and enhance funding for the government’s various charitable programs, the Philippine Charity Sweepstakes Office (PCSO) has partnered with DFNN in launching ‘LottoMatik,’ a handy, portable point-of-sale (PoS) device.
$PSE:PSEI $PSE:DFNN
read morelotto matik na naman ang jackpot winner 😂😂😂...kaya pala nauna na sila mag bodega...
$PSE:PSEI 6,095.97 - Feb 24, 2025
read moreDUBAI TO SHARJAH ROUTE | FREE TOLL - https://youtu.be/tqR41WrN7-k
Net Foreign buy/sell: -632.57M
Today's gainers with reasonable volume: $PSE:DFNN , $PSE:APO , $PSE:MRC , UPSON, URC. Check Full Daily Report here: https://facebook.com/PSETipsnPicks
𝐋𝐈𝐊𝐄, Comment, Subscribe and 𝐒𝐇𝐀𝐑𝐄!
- - - - - - - -
#ofwnomad
DUBAI TO SHARJAH ROUTE | FREE TOLL - https://youtu.be/tqR41WrN7-k
read more$PSE:PSEI 6,098.04 - Feb 21, 2025
Net Foreign buy/sell: -423.38M
Today's gainers with reasonable volume: $PSE:DFNN , $PSE:APO , $PSE:MRC , UPSON, URC. Check Full Daily Report here: https://facebook.com/PSETipsnPicks
𝐋𝐈𝐊𝐄, Comment, Subscribe and 𝐒𝐇𝐀𝐑𝐄!
- - - - - - - -
#ofwnomad