In any kind of team sport having LEADERS is always important.
The names we give positions of leadership whether they be managers, trainers or coaches are mostly only made to define specific roles in a team. As backseat personalities, such roles can overlap. They are there to either provide logistics, formulate strategies and game plans, or give instructions in real time situations. Among those other components of course, they must share the visions and ideals of the team and would be expected to work hard to PREPARE it towards achieving set goals.
When game time commences, while coaches still play active roles, the burden of performance now shifts to the players. Physical and mental conditioning during the training phase are critical to the outcome. Endurance and tenacity usually become differentiating factors. One team may easily dominate a league if and when it is properly trained, well coached, and have a roster of talented players. In real life sports competitions however, close matches usually tend to happen. And at crunch time, leadership qualities will inevitably become of much higher importance.
In a game of basketball for instance, while positions may have been set with roles well defined, a single person is almost always tasked to initiate plays and carry the burden of leadership. Most often, the POINT GUARD takes the helm. He/she would surely not only have excellent ball handling skills, but the needed “command and court sense” to execute set plays.
The POINT GUARD must also be able read into the defense, put the play into motion and when needed, modify or innovate by providing visual or audible signals to his team mates as the situation calls for it.
In the end, the objective of scoring against the opponent is achieved only if most of the players contribute either by moving the ball into scoring position, giving out an assist, providing a pick or a screen, and most important of all, TAKING THE SHOT.
Of course, not all shots will go in. But if the players know and have confidence in their skills, they TRUST and execute the play. Whether drawn or improvised, taking the shot before time expires is an absolute must. You might miss it and make only say, half your attempts. That will always be better than not taking one.
In an actual game, the PG (point guard) is expected to perform most of the following: Know the players on the court for his team in terms of their capabilities particularly the strengths and weaknesses of each and every one.
Communicate instructions on the fly and execute drawn up or preset or plays.
Survey the field of direct and peripheral vision and read into the opposing team’s defense (or offense). He must make his unit react to on-court movements and respond accordingly to evolving situations. He must always improvise when necessary.
Provide visible leadership that will spur his team mates to raise their level to confidently gain and achieve victory.
People who trade the market should be like point guards.
Although except for the most part we are all only a one-man team. Sure, we sometimes collaborate with other traders or maybe become members of a small, like-minded community but in the end, we play the game alone and by ourselves.
That does not mean though that we cannot apply the “game on” mentality. After all, we constantly train ourselves by being actively or passively engaged in the market. Eventually we evolve with a skill set not unlike a prized POINT GUARD.
Here’s how:
Finding high probability trades using an objective process of stock selection.
Like PGs we survey the court and pick on which side is best to create a play. We carefully consider available choices using set criteria as volatility, momentum, and liquidity and pick a path to follow. Needless to say, picking the right stock to play with is an all-important process that we try to master. It’s like having a DREAM TEAM in your portfolio where when chosen correctly should paste a smile on your face. For us traders, it should not be about popularity although a favorable market sentiment is always welcome.
A methodical trader will always let the numbers do the talking. Quant-based methods provided by trading support providers (like BoH Society) are both impersonal and objective. And preferably using a mathematically-derived short list of candidates in a field of current market leaders that exponentially increases chances of success, we decide on where to set our laser sights on.
Knowing the strengths and weaknesses of our potential trades.
Great PGs are like playing coaches. By both instinct and experience they know which options they can take to create mismatches against the opponent. He finds them and exploits the perceived disadvantage. Loosely translated, it would be like how we view the possible setups, in relation to supports and resistances, and ultimately in the actual Reward to Risk ratio (R/R).
Buying near supports and selling near resistances is the simplest strategy anyone can take. And by most standards the best one that should rack up your wins.
Employing the capabilities of various chart indicators.
In modern day sports programs, the good ones recognize the value of data. When you are using algo-based information, statistics are gathered, collated and brought to life as visual infographics. Most often, team leaders like the PGs are given this information and during pregame huddles discuss with the coaching staff how to work with such in offense or defense plays.
For us traders, this visual data is available in select indicators for us to interpret. The more common ones like Stochastics, RSI, various moving averages, Bollinger bands, etc., can provide evidence or confirmation of price behavior.
It’s quite simply like putting trust in a closely-knit team that you know is there to support you. Of course as they say, less is more. As each has a defined role that has been tested and proven, the trader must now rely on each one to deliver pertinent information that can be useful at the most opportune time.
Execute a trading plan with a proper scale of commitment(aka position size).
A good PG always knows how to set the right pace. In a 48-minute game, he is not likely going to run fast breaks every time. Instead he would try and change the pace every so often and keep the opposing team guessing. Tactics require variations in order to be effective and conserving energy for an end game is crucial to winning.
This is a strategy that all traders must hold dear and have ingrained in their minds.
Capital preservation is always of paramount importance. We need to constantly realize that the only improvisation available for us is in having the will to cut losses, adjust trail stops, average up, or simply take profits. Like the skillful PG, a decisive advance or retreat is the key to securing long term success as traders.
Because win or lose, there is always the NEXT GAME.
Contributor:
Name: Jojo Gaston
Investagrams Username: @JojoGaston0
About the Contributor:
Jojo Gaston is a partner/mentor at BoH Society, an online trading support group that provides traders’ education, and data driven trading format for local stocks, forex, and other foreign markets.
Investagrams’ most powerful suite of tools is now FREE FOR 14 DAYS!
ACCESS YOUR INVESTAPRIME ELITE FREE 14-DAY TRIAL TODAY.
Investagrams, the fastest growing social-financial platform, is opening the newest FREE Stock Market learning space named InvestaUniversity. The online university offers basic to advanced lessons about finances and investment to all.
No matter the financial status, age, experience, and education — everyone can learn how to invest in the stock market. Everyone can improve their financial lives through wise investing. Everyone is accepted into the InvestaUniversity.
The mission is to create at least 10 Million investing Filipinos. And Investagrams saw that the only way to make this a reality is to help all Filipinos be educated about the unlimited opportunities in the stock market. Hence, the birth of InvestaUniversity.
Investagrams pooled in a team of educators — JC Bisnar (CEO of Investagrams), Christian Silverio (Investagrams’ resident trader and private fund manager), and Paolo Tomacruz (Investagrams’ resident trader and private fund manager) who will break down the complex concepts of the financial markets to easy-to-learn and friendly weekly lessons.
To further the students’ learning, InvestaUniversity has also prepared activities and homework which will be discussed in the live online discussions.
“In InvestaUniversity, no one gets left behind. All the courses, the videos, the core curriculum, ia-upload natin ang mga lesson sa ating mga ng channels — on Youtube, Facebook, and on InvestaLearn platform — all for free. Kung gusto mag-participate, mas magkaroon ng commitment, magkaroon ng access sa mga benefits, then you can pay a tuition fee. At the end, bahala ka na literal. Dito sa InvestaUniv, we want it to make it as open and as inclusive as possible, and InvestaUniversity will make sure that no one gets left behind,” JC Bisnar, CEO of Investagrams said in their launch video.
Your tuition, your call.
Promoting education for all and inclusivity, Investagrams made InvestaUniversity’s core program to be free. But if you want to commit, participate in the weekly activities, and gain some perks, you can settle a tuition fee of your choice. Whatever the amount, it’s all up to you.
This program and tuition fee scheme may be the first of its kind in the Philippine Stock Market.
To enroll in InvestaUniversity, simply follow these 3 easy steps:
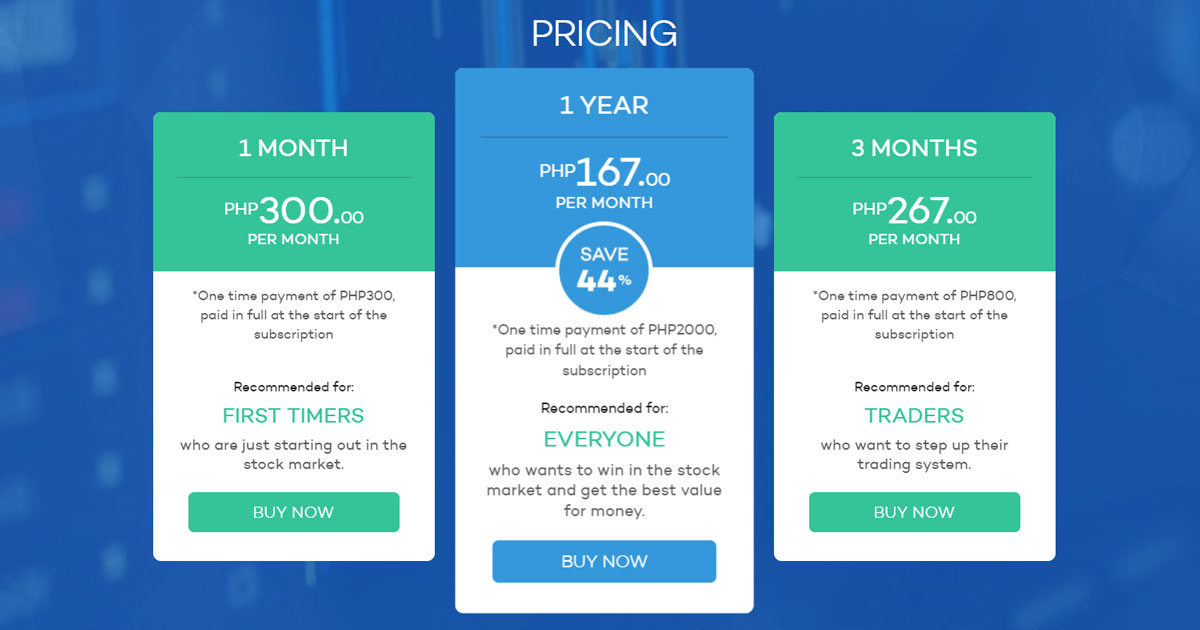
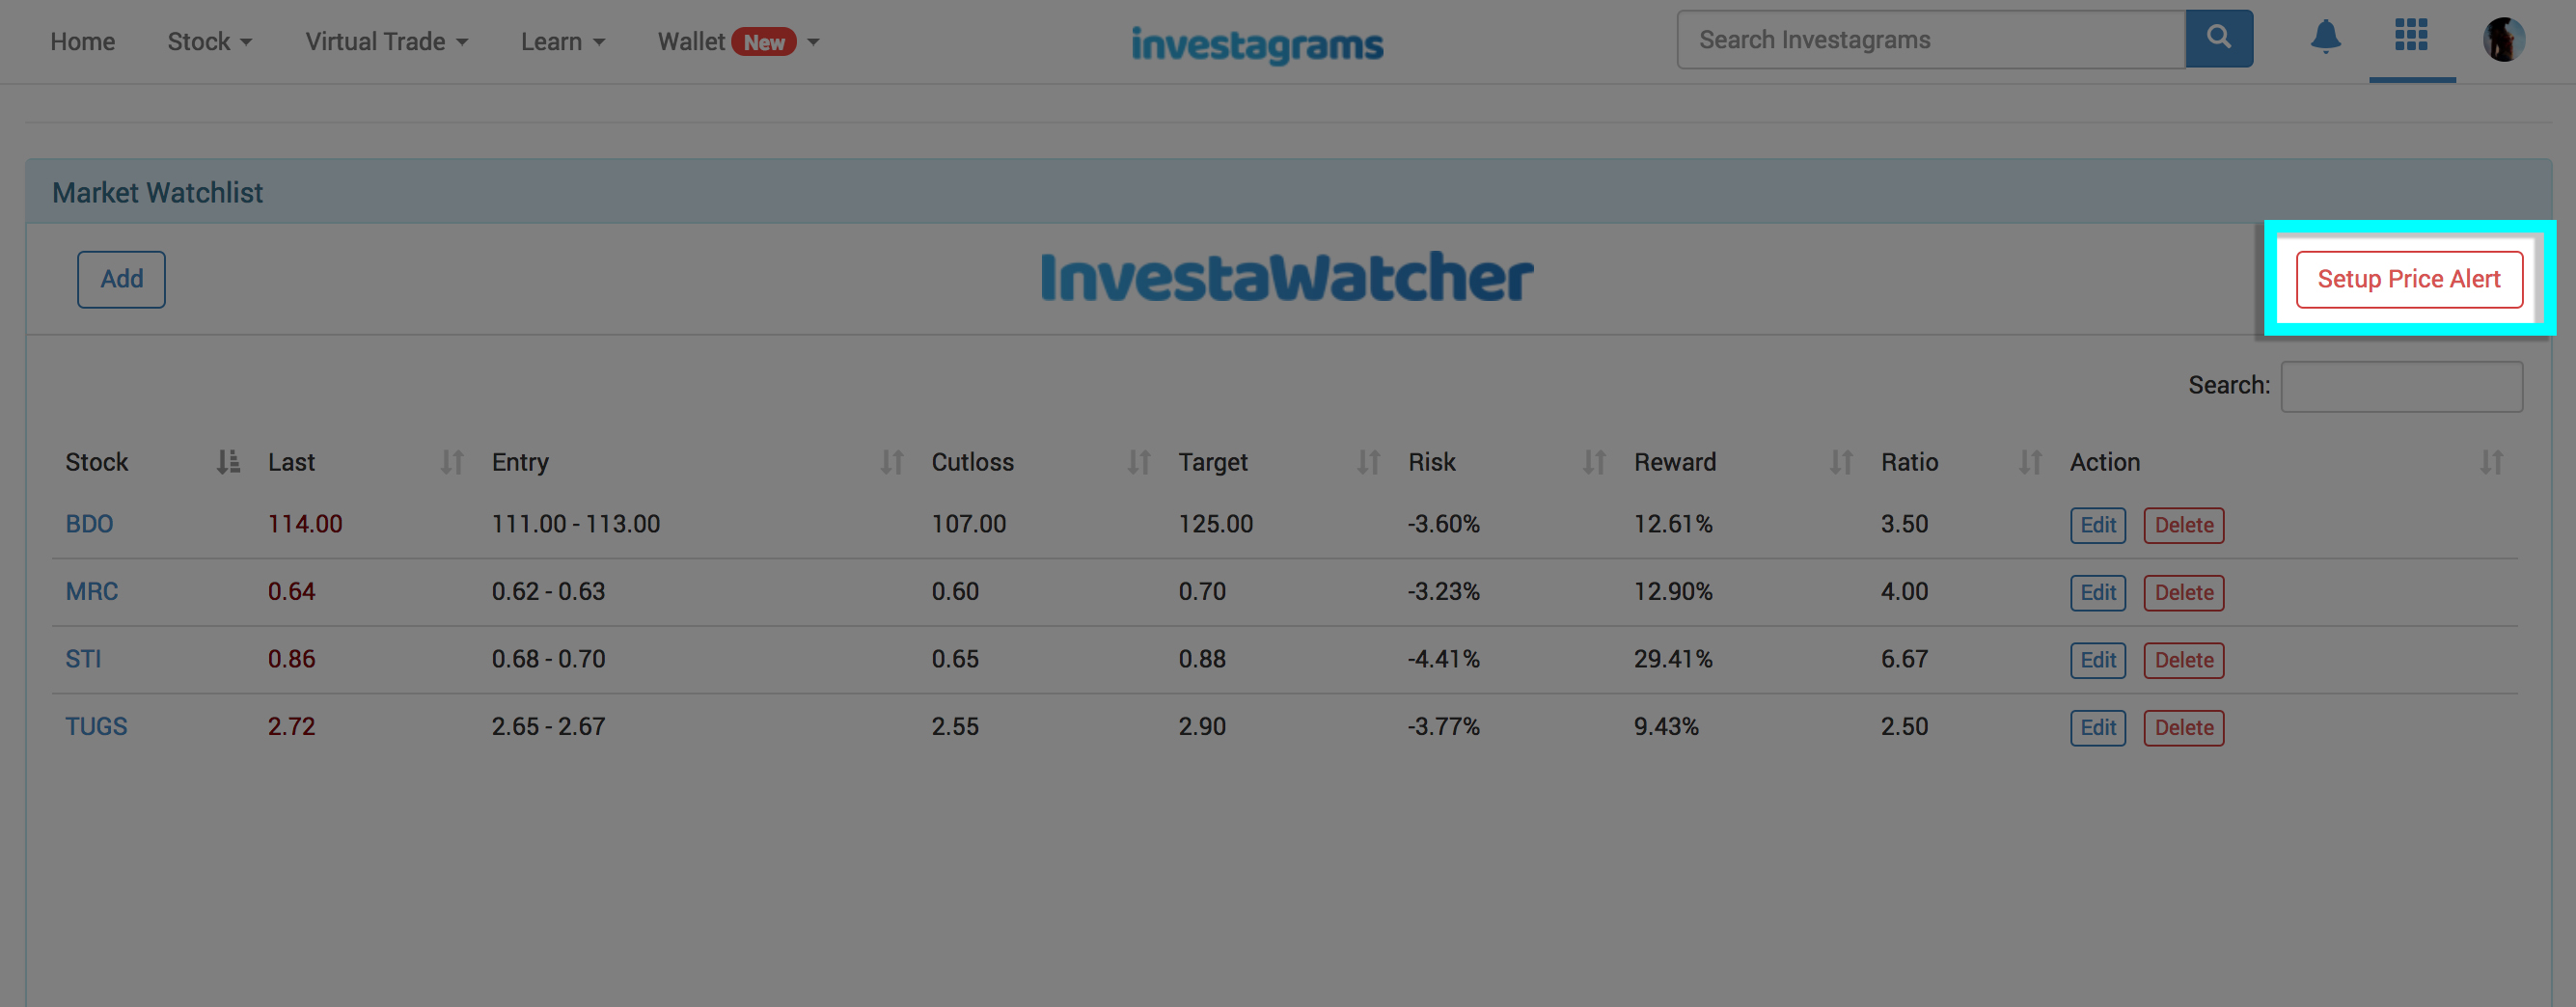
One of the most common reasons why people don’t invest is because they “don’t have time” to monitor the stock market. Well, with InvestaWatcher you can let us watch your stocks for you! Scroll down to see how you can set up your own InvestaWatcher account in just 3 easy steps.
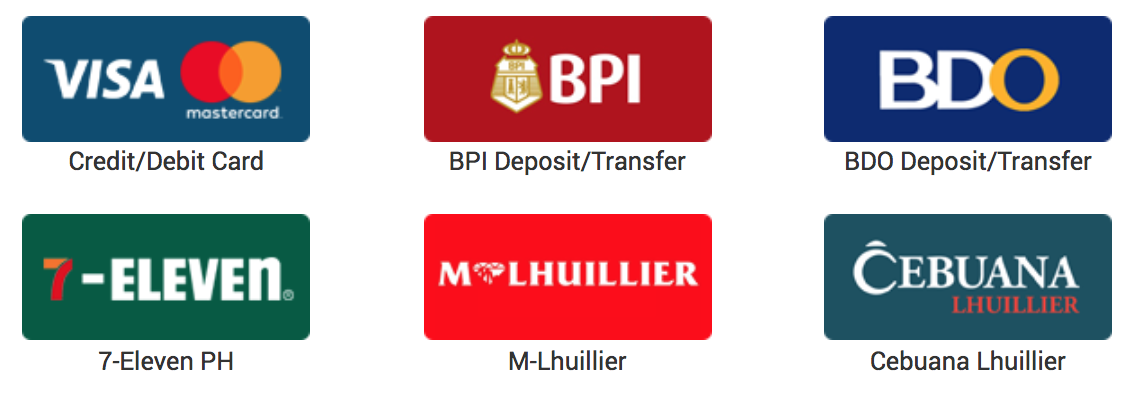
Settle your payment through Debit/Credit Cards, bank transfer to BPI or BDO (deposit or online funds transfer), or at any 7-Eleven, M-Lhuillier or Cebuana Lhuillier branch.
STEP 2: ADD STOCKS TO YOUR WATCHLIST
Once your payment has been confirmed, you can start adding stocks to your watchlist.
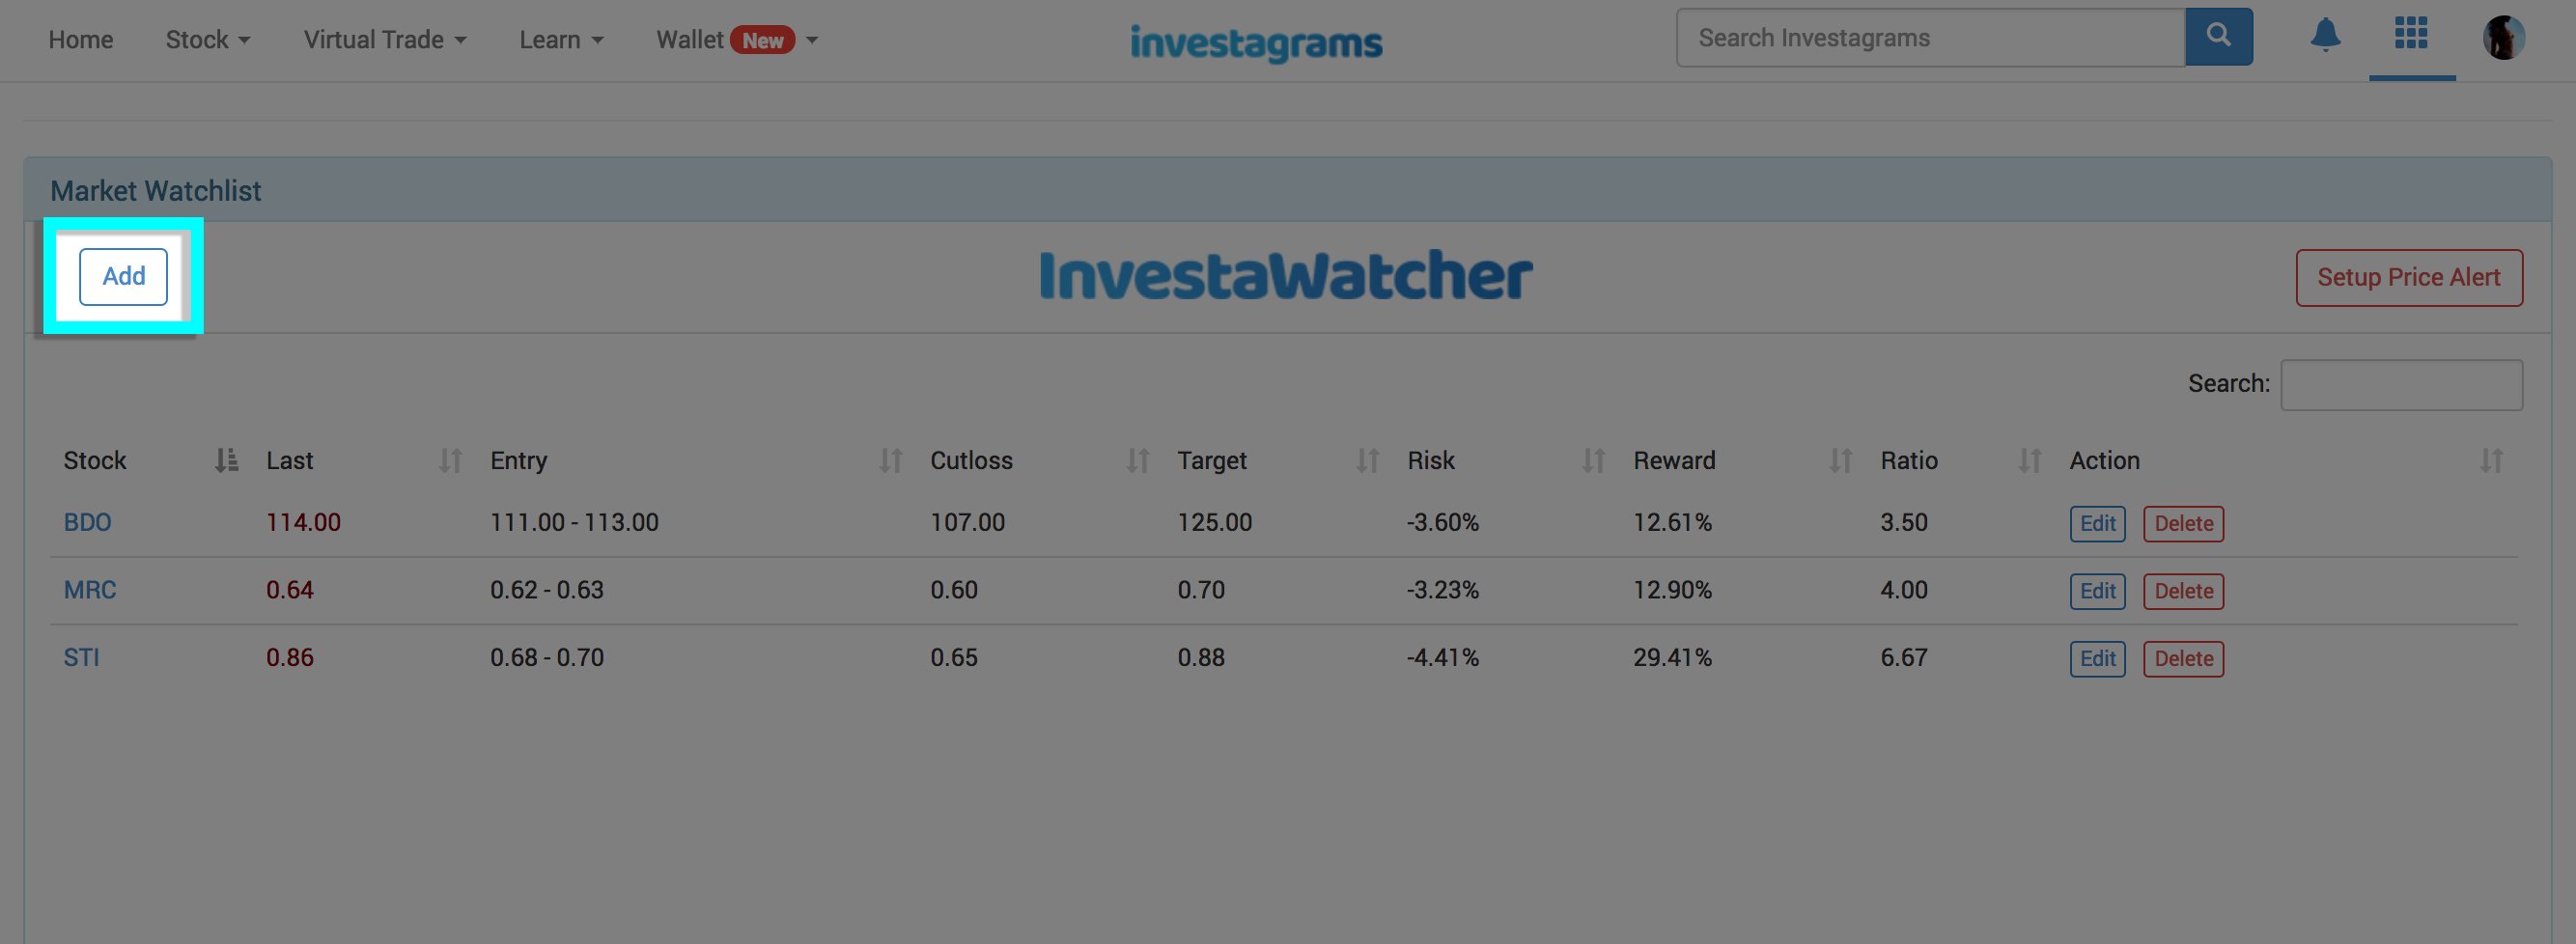
Simply go to your Investagrams account and click on the “Watcher” tool on the upper right corner.
Once you land on the InvestaWatcher page, click “Add” to start adding stocks to your watchlist.
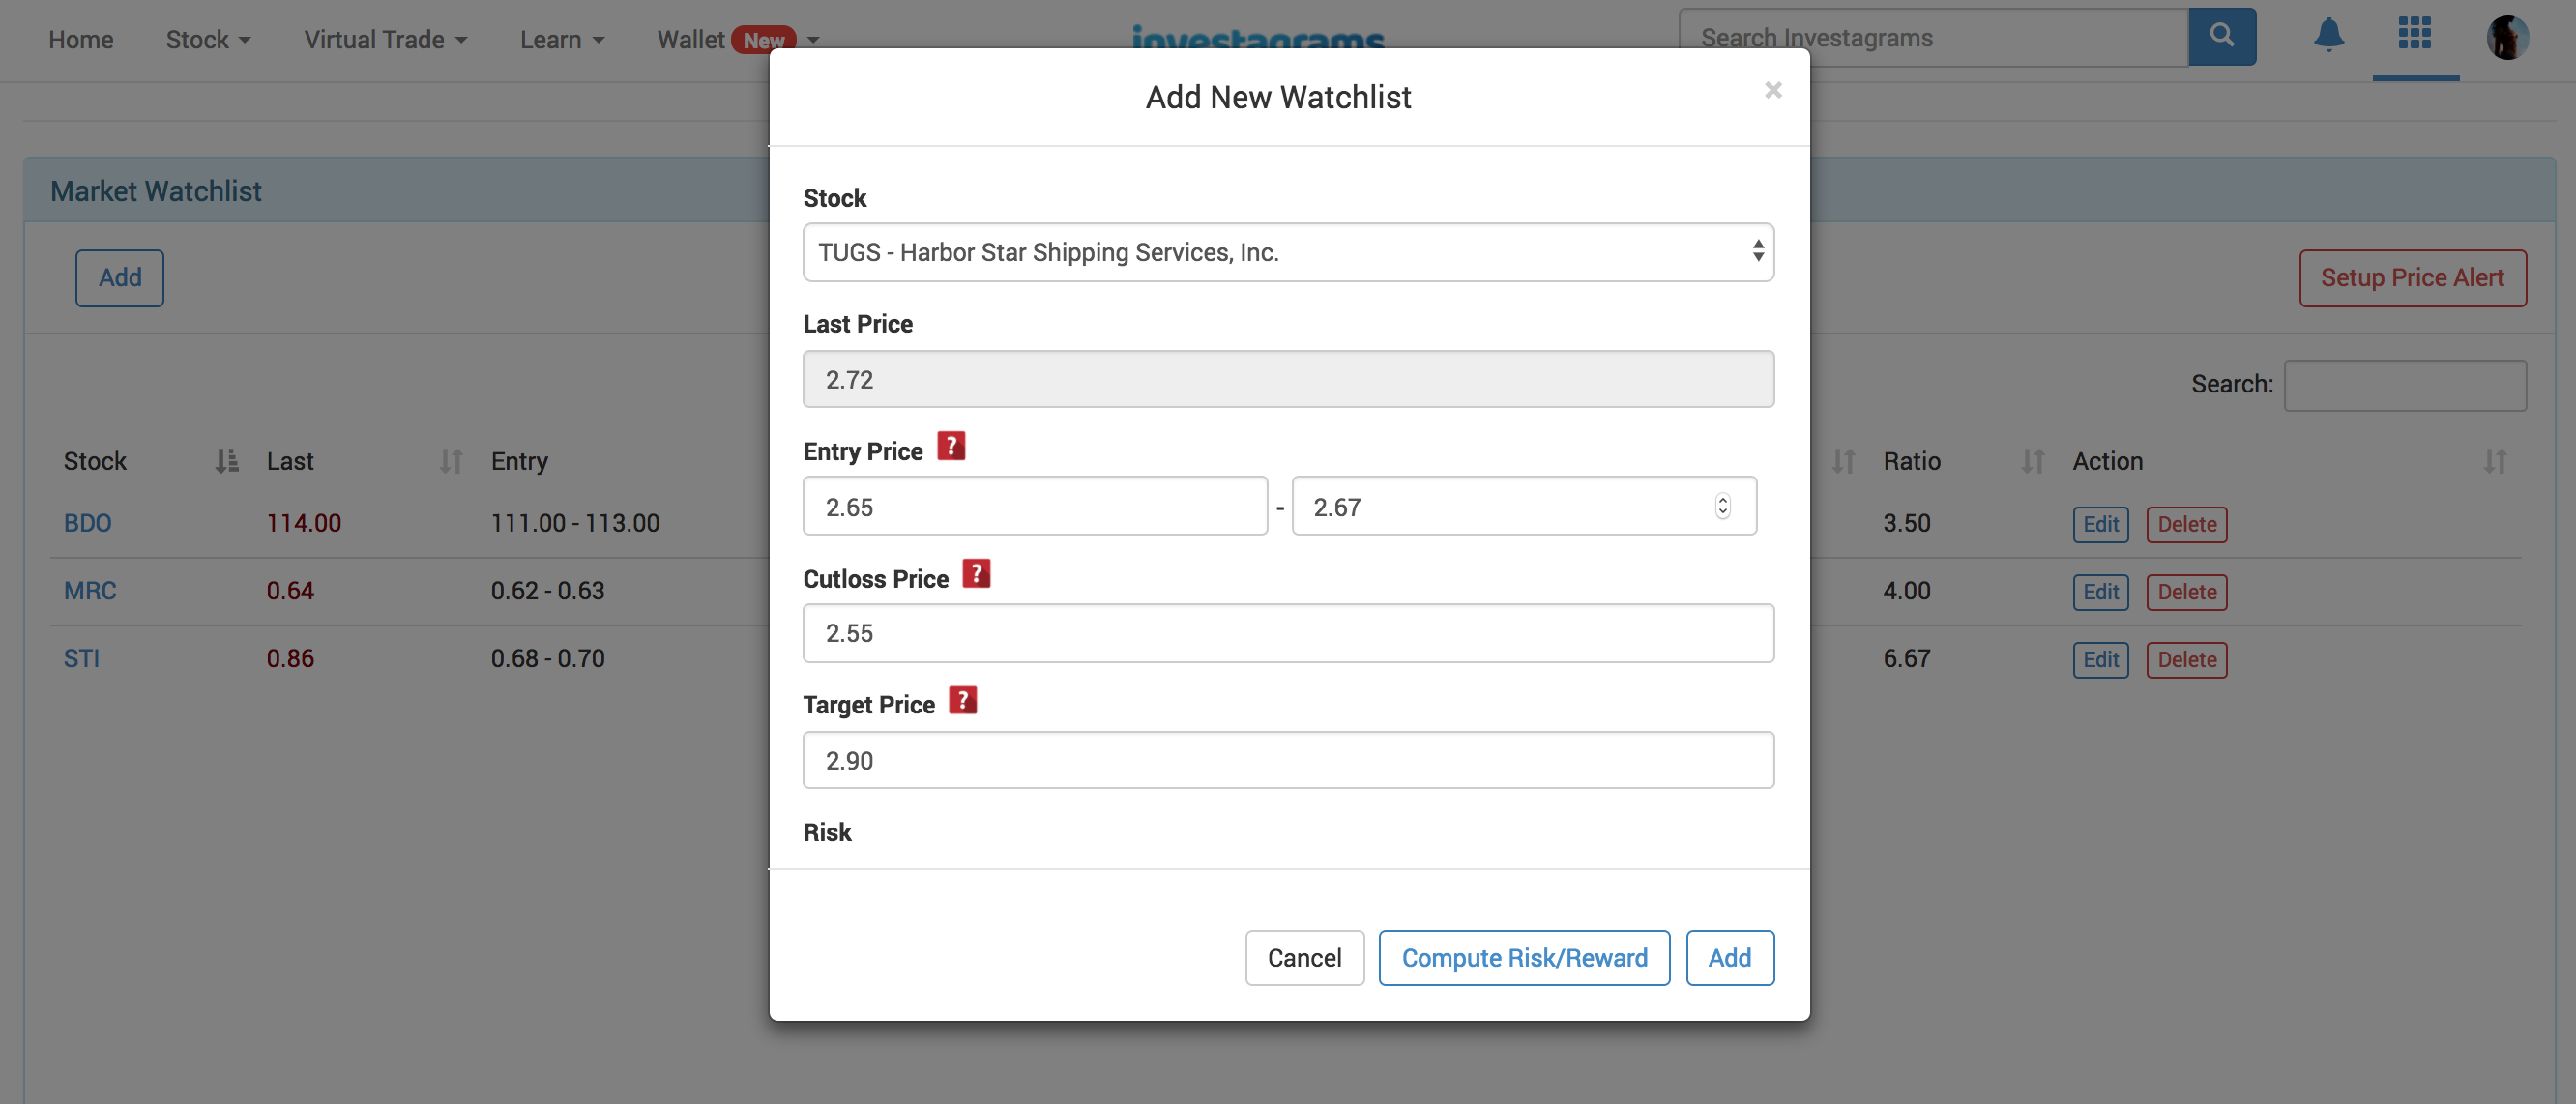
A pop-up will appear for you to input your stock pick, entry, cutloss, and target prices:
Entry Price – The range of prices where you want to buy the stock. You will only receive an alert if the price hits this range. If the price jumps past your defined range, you will not receive an alert.
Cutloss Price – The price where you plan to cut your losses and sell your shares. You will receive an alert if the price reaches or falls below the number you enter.
Target Price – The price where you plan to sell your shares and realize your profit. You will receive an alert if the price reaches or goes higher than the number you enter.
Once you’ve entered all the information, click the “Add” button on the lower right of the box to finish setting up your stock.
Repeat this for all stocks you want to add to your watchlist. You can add up to 15 stocks.
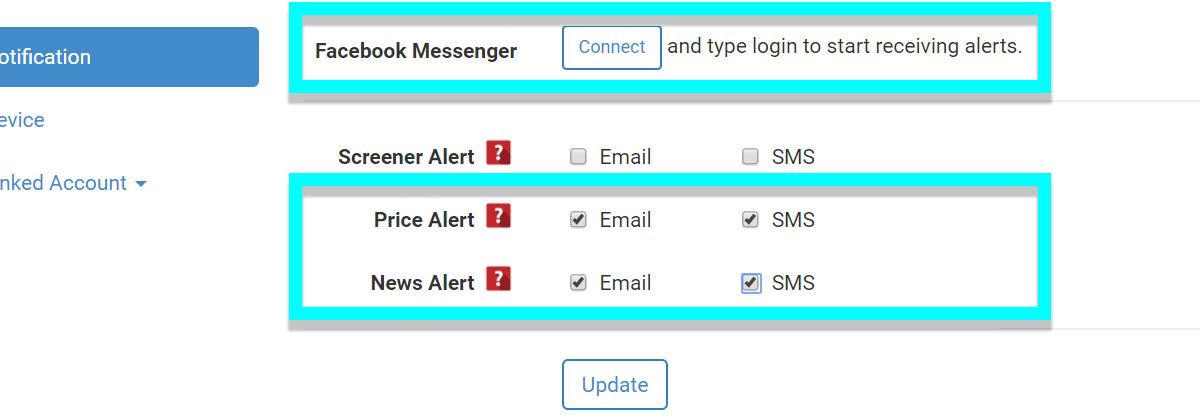
STEP 3: CHOOSE HOW YOU GET YOUR ALERTS
To customize how you get your alerts, just click on “Setup Price Alert” on the upper right corner of your InvestaWatcher page.
You will be taken to the settings page where you can choose which information you want to receive alerts on—price alerts only, news alerts only, or both. You can also turn alerts on or off for SMS, Facebook Messenger, and email.
That’s it! Now you can sit back and relax as we watch your stocks for you. Easy, right?
Not yet subscribed to InvestaWatcher? Click here to learn more and start hassle-free trading now!
I failed more than a dozen times in college and I thought my life was over, until the day I earned my first few pesos from trading the Stock Market—my first stock was Ayala Land by the way.
Here in the Philippines, we are taught that going to a reputable university and being a good student are the only ways to land a great career and be financially free. While this can be true at times, the current status of most young adults in our country says otherwise.
You know why? Because the number of graduates doesn’t match the number of employees needed by corporations. The reality is you have to compete with other fresh graduates or worse, those that already have work experience. How can someone who doesn’t have any experience compete with someone who are already tenured?
This is also the reason why I LOVE the Stock Market. First of all, it doesn’t care about YOU, your Educational Status, the amount of Money you have, or even your Connections.
Everyone is in equal footing when it comes to STOCKS and those who work hard consistently and put their focus on things that truly matter wins.
2. You won’t succeed if you don’t take calculated risks.
Remember the word “CALCULATED.”
Someone once said, “A ship is safe in the harbor, but that is not what ships are built for.”
If you see the stock market like a casino, it will treat you as a gambler; but if you treat it as a great source of wealth, it will give you what you work and sweat for. I’m not saying that you should start investing your life savings and, in a few days, expect to become a millionaire. It doesn’t work that way. Every one of us has different risk profile and risk appetite: Younger people can be more aggressive than those who are older, a single person can take more risks than a married person… AND GUESS WHAT? THAT’S PERFECTLY FINE!
No matter how early or late you start, if you put your focus on mastering risk and analyzing companies, YOU CAN STILL BE SUCCESSFUL in this field.
I’m not pushing you to invest in stocks and change your life if you are happy and contented to with what you’re currently doing. If you’re happy with the path you’re on, keep going and ever stop! But if you think the stock market might be the path for you, why not give it a try? The stock market is a great avenue for you to build wealth and have more time for the things that truly matter. Start planting seeds today because sometimes before you know it, it’s too late.
Seeds can be destroyed by the storm, scorched by the heat of the sun, or inundated by the flood. YOU MUST PROTECT YOUR SEED because a Fruit Bearing Tree that can feed your family is 100% worth the Risk.
3. Money is a tool, but it alone won’t make you happy.
Money is a tool, but it won’t make you happy—but it can buy you time which you can use to be with the people you love, travel to places you’ve never been, ride a jetski, ride a helicopter, experience skydiving, and live without the anxiety that tends to come every time it’s time to pay the bills. Do you get what I’m saying here?
The truth is, the LACK of money will not make you happy as well. In fact, it will likely make you miserable and unable to enjoy the better things in life.
Money in itself won’t make us happy, but the THINGS we buy, the EXPERIENCES we share, the SECURITY we give our family, and the TIME we spent to fulfill our Purpose and Calling. That is true happiness.
“and above all our dreams and aspirations, we should also remember to use money to love people and not use people just because we love money. “
4. You can, but only if you will.
YOU CAN achieve whatever you want in this world if YOU WILL start putting in the work.
YOU CAN be a better person if YOU WILL take failures as lessons.
YOU CAN master any craft that you want to master if YOU WILL focus on building your skills and talents.
YOU CAN reach greater heights if YOU WILL be willing to give up the good for the best.
YOU CAN make a change in your country if YOU WILL make time to change and improve yourself.
YOU CAN be what you want to be if YOU WILL be willing to write your own destiny.
YOU CAN do the impossible if YOU WILL decide to take on the challenge.
YOU CAN only if YOU WILL.
5. Money is never the end goal.
The true goal is to reach a point when you can say to yourself: You’ve finally made it! You’ve finished the race, fought the good fight, and made an impact on the people around you.
This is also the reason why we started Investagrams. We wanted to share how investing can change your life and the lives of the people under your influence. We wanted to cause a ripple effect strong enough to influence more Filipinos here and abroad.
Thank you for taking the time to read this article. I’m really hoping that this will help and inspire you to find your purpose, reach your dreams, and fulfill your calling.
One last thing…
If you want to take that first step towards financial freedom but don’t know where to start, we’ll be having an event this coming April28in SMX Convention Center MOA! The event is called InspirePH. We’ve gathered some of the BESTPEOPLE from different industries such as the STOCK MARKET, STARTUPS & BUSINESS, and even DIGITALCURRENCY to share not just their story but also their mistakes, their motivations, and how they were able to succeed in their respective fields.
Just like you, a lot of the participants want to make that decision to strive towards being financially free. Take this chance to MEET PEOPLE and NETWORK, who knows? Your new business partner might just be around the halls of SMX!
For only PHP1,999 for InvestagramsMembers (You can register for free at www.investagrams.com), you can that first step to learn the ins and outs of Trading the Stock Market, Building your own Startup or Business, and even using different Digital Currencies. From having ZERO idea about the topics, you can jumpstart your way to EARN from these vehicles!
The Philippines is a great country to investin, that’s why most foreigners choose our country for their businesses and investments. But the SAD REALITY is that most of the benefits go to the rich and the foreigners who took the risk of investing. Meanwhile, only less than 1% of Filipinos are invested in the Stock Market.
Don’t you believe in the potential of the Philippines? Don’t you want to be part of this growth?
EIGHTDays left and FEW SEATS remaining for this event.
Be part of the 1%, get your tickets at www.inspire.ph and make it happen!
*All the proceeds for INSPIRE PH will be used for the IMPROVEMENT of our platform. It will also FUEL our MISSION to make more Filipinos here and abroad financially free!
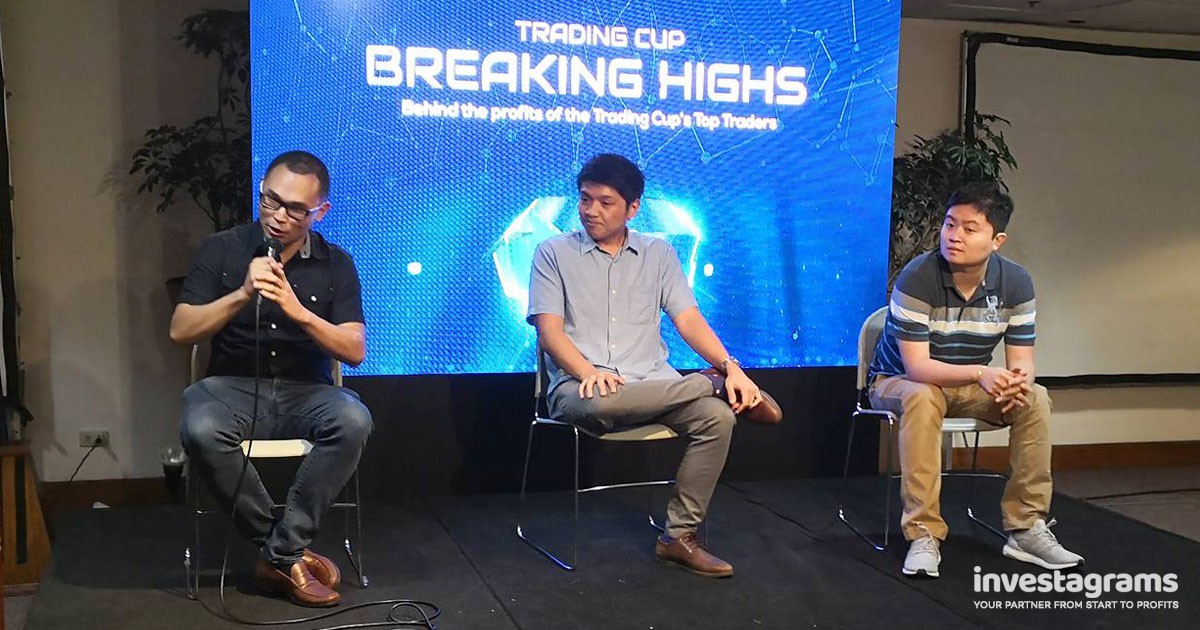
Last January 20 marked the culminating event of Investagrams’ first major competition—the Investagrams Trading Cup 2017—and the turnout was absolutely incredible! Our hearts are truly overflowing and we are sincerely thankful for all the support from newbies, experienced traders, and even masters of the market.
We created the Investagrams Trading Cup to provide a fun avenue where everyone could showcase and improve their trading skills, but the turnout was more than anything we could have imagined. The competition was intense and we were amazed by the caliber of traders that came out on top.
Out of the almost 2000 traders who joined the competition, those who led the pack were truly inspiring and extremely generous in sharing their wisdom and experiences. Here are just 10 lessons out of the hundreds we learned from the Trading Cup 2017’s top 10 players.
#10
@joelduque: Work smarter, not harder.
Joel duque is the living proof that you don’t have to trade actively to earn significant profits. Through proper filtering, he was able to handpick stocks that had great potential and allowed him to bag the top 10 spot.
#9
@tris0314: Always be learning—from others and from yourself.
Tristran Montano shared his most significant trades throughout the competition, and highlighted the importance of learning continuously if you want to achieve success. He learns from various online blogs, websites, and his own history of trades.
#8
@MoneyGrowersPH: It’s never too late.
Despite lagging in the competition early on, he kept his composure and his winning attitude. In the end MoneyGrowersPH was able to rise up and prove that he indeed is one of the top traders.
#7
@Smalltime: There’s always a way to make it work.
Richard Baco is an OFW based in the Middle East. Despite holding down a full-time job, being in a different country, and even being in a different time zone, he still found a way to get the top 7 spot. He even gave a recorded video presentation since he couldn’t fly home for the culminating event.
#6
@Junster: Quality is more important than quantity.
You don’t have to have tons of trades to be profitable. In life and in trading, quality is almost always more important than quantity. When executing your trades, Joseph gave us these words of wisdom: Losing is inevitable. It’s part of the game. Just remember that you can win small, win big, lose small, but never lose big.
#5
@chad3ie: Focus on what’s really important.
Chad is one of the best traders of Citisecurities and a teacher in the Caylum Trading Institute. Aside from sharing some of his best tips, for life and trading, he reminded us of what’s really important—at the end of the day, what (or who) is it that we are trading for?
#4
@Scraffycoco: You can achieve your dreams at any age.
Rafael won 6th place in the Investagrams Stock Market Challenge last 2016 and has always dreamt of sharing his passion with a larger audience. Despite his young age, he proved that age is not a measure of mastery, and that with hard work and passion you can compete even at the highest level.
#3
@zeefreaks: It’s a jungle out there, but you can conquer it.
The mysterious head of the Zeefreaks Tribe and definitely a deserving leader in terms of skills and passion. During the competition, he proved to everyone that he is indeed one of the best traders in the Philippines. He shared his insights on how he studies and understands his prey before striking at the precise moment to capture the most profits.
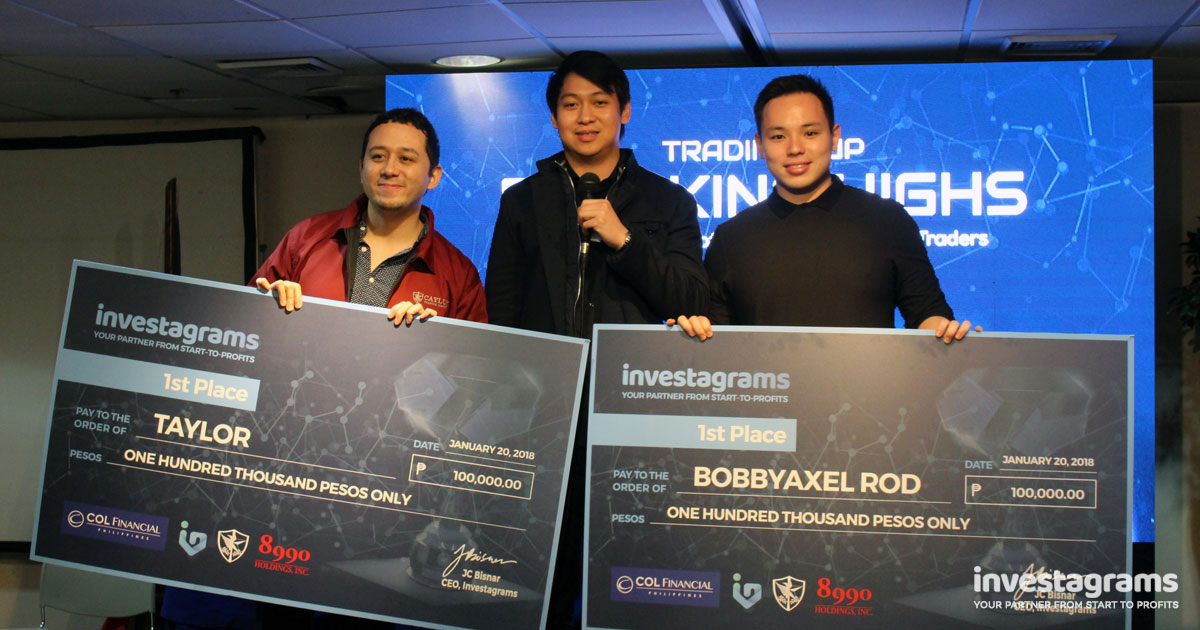
#1
@bobbyaxelrod: There are always opportunities. You just have to know how to find them.
Edu bagged the most profits in the competition through his skills in finding momentum based trading opportunities. He shared simple but incredibly powerful tips for how he makes the most of the opportunities in the market.
#1
@Taylor: Above everything else, commitment is key.
One of the few masters of Elliot Wave here in the country, Javi used the Elliot Wave together with set-up based trading to consistently find great opportunities in the market. Through years of sharpening his trading style and skills, he was able to become a master trader and the champion of the Investagrams Trading Cup 2017.
These guys presented their strategies and trading tips in our Breaking Highs event last Jan 20, and even those of us who are experienced traders still learned a lot from them.
For those who weren’t able to attend, don’t worry! You can still watch the FULL VIDEO of all presentations and discussions. Click here to get access.
Support and resistance may be one of the most basic concepts in stock trading and technical analysis, but it is also one of the most useful. If you know how to use them well, you can already start building a profitable trading strategy. So here are 3 simple but powerful ways to use support and resistance in making profitable trades.
1. Find the best time to buy or sell your stocks.
This is a very basic use of support and resistance, but it is still one of the most effective.
The support and resistance levels often serve as an indicator of a coming shift or reversal of the current price movement. These levels serve as a guide for when we should start buying or selling a certain stock.
We buy stocks as the price nears the support level. Once it reaches the support, demand becomes stronger than supply and more people will want to buy that stock, making the price go up.
On the other hand, we sell stocks as the price gets closer to the resistance levels because this is when you can sell for the highest price. When the stock reaches the resistance level, more people will want to sell and the stock price will start going down again.
2. Identify stronger support and resistance by the length of time.
There are many support and resistance levels that can be found in a chart based on how long or short the time frame is. The longer the time frame, the stronger the support and resistance and the harder they are to break. In other words, a 10-year support or resistance is much stronger than a 1-month support or resistance.
Although the interpretation of a chart is subjective and different for everyone, seeing the bigger picture gives traders an idea of where the stock can go and how easy or difficult it will be for the stock to get there.
Next time you’re looking at support and resistance, try looking at the support and resistance across different time frames to see what the big picture really looks like.
3. Spot potential breakouts, which can lead to huge profits.
The resistance level, once broken, becomes the new support level. If sustained, it gives traders an idea that there is very strong demand for the stock. Breakouts like this usually signal the start of a major price trend, which can lead to huge profits.
This increased volatility during breakouts attract traders because it can offer great returns with a minimal amount of risk, especially if there is no existing resistance in place (i.e. when a stock breaks out to a new all time high).
Keep an eye out for breakouts and wait to see if they are sustained. If they are, it’s likely that you’ll be able to make a profit off of buying that stock.
Don’t forget, you can also combine these concepts to make your trading decisions.
For example, if you see that a stock has broken above its 10-year resistance, then you know from #2 and #3 above that it has the potential for huge profits and you should definitely consider buying that stock. If you want to buy a stock but it’s near its resistance level, then maybe wait a few days to get a better price.
Simple moves like this, applied consistently and with proper risk management will help you become a more profitable trader.
Do you have other tips and tricks for using support and resistance? Let us know in the comments below!
A lot of people ask us, “What is the best investment for beginners?” or “Saang investment ba yung ok?” There are so many options these days that it’s hard to figure out the difference between them all.
So how do you find the best investment for you? It all starts with getting to know yourself. Parang love lang yan. You can’t find your perfect match if you don’t know who you are and what you want. (What you really, really want.)
A lot of people would just say, “But I know what I want. I want to make as much money as possible!” Well, that’s the catch isn’t it? Do you know what’s possible given your current situation? Every person has different resources and abilities, so here are some questions you need to answer first before deciding where to invest:
1. How much money can you invest?
As the saying goes, you need money to make money. Each peso you invest is like a seed—the more seeds you have, the more trees you can grow, and the more fruits you can harvest. The more money you have to invest, the more money you can aim to make.
The amount of money you can invest will also determine which investment options are available to you. Investing is not only for the rich, but there are some investments that require a lot of capital.
A good rule of thumb to find out how much you can invest is to subtract 6 months worth of expenses from your savings. The remaining amount is what you can invest.
Total Savings – 6 Months of Expenses = Investment Fund
Every month, make sure you still have enough money to cover 6 months worth of living expenses before adding more money to your investment fund.
It’s important to keep your investment fund separate from your living expenses because investing is not a get-rich-quick scheme. It takes time. If you need to pull out your investment too soon, then you’ll likely end up losing money—and nobody wants that.
2. How long can you keep your money invested?
Aside from money, another very important resource when investing is time. The longer you’re willing to keep the money invested, the more investment options you’ll have and the more money you can potentially make.
Because of compounding interest, your money will grow exponentially faster every year you keep it invested. As the interest from your investment is added to the next year’s principal amount, the impact of compounding interest becomes so big that the amount of time eventually outweighs the amount money you invest.
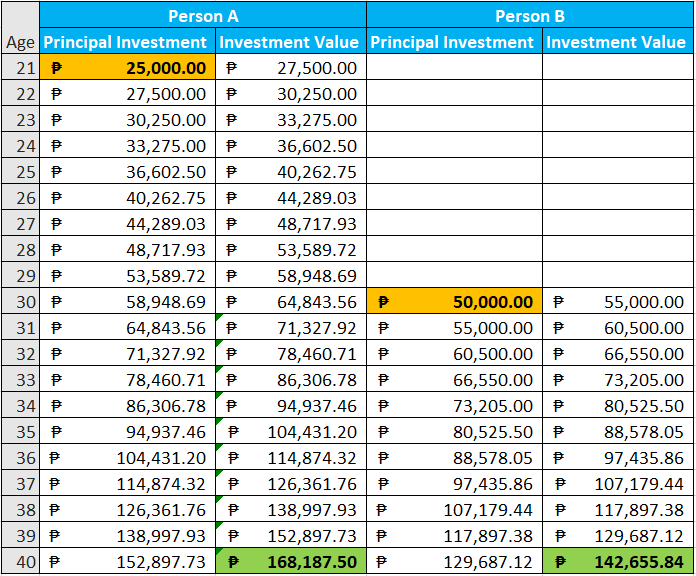
Here’s an example showing two investors, Person A and Person B. Person A invested P25,000 when he was 21 while Person B invested P50,000 when he was 30. Assuming the interest rate is always 10% for both cases, you’ll see that Person A’s investment will actually be worth more when they’re both 40 years old—even though Person B put in twice as much money.
When investing, think long-term. You’ll get the best results if you can invest your money for 10 years or more.
3. How much effort can you put into managing your investment?
If you have the time and dedication to educate yourself and manage your own investment, then you can save a lot on fees that would normally be paid to fund managers and financial advisers. It may even open up some investment opportunities that you couldn’t consider otherwise.
For example, a lot of people nowadays are marketing small businesses as investments—food carts and farming are just two examples. People will automatically ask “Ok ba ito?” and someone who has done it before might say “Oo! Laki ng return ko diyan!”
While it’s true that businesses can be great investments, they will only succeed if you put in the time and effort to run it well. Otherwise, you’ll just be throwing your money down the drain.
If you don’t have the time and energy to manage a high-maintenance investment, don’t worry. There are a lot of other investment options out there, which we’ll discuss later.
4. How much risk are you willing to take?
By now you’re probably tired of hearing this over and over, but it’s true—if you want bigger rewards, you’ll need to take on bigger risks. It’s difficult is to figure out exactly how much risk is right for you, but one thing’s for sure: There is no risk-free investment.
If you’re putting your money somewhere that’s risk-free, the interest rate will be so low that you end up losing money due to inflation. And if you’re losing money, then that’s not really an investment anymore.
Take savings accounts for example: Banks guarantee to keep your money safe and you definitely won’t lose a single centavo. However, the interest rate for most savings accounts is only 0.25%. That’s around 2.75% less than the average inflation rate, meaning that the value of your money decreases by 2.75% every year!
On the other hand, investing all your money in a new company that may or may not exist next year could lead you to lose all your money. But you might also have invested in the next Facebook and end up making a bigger profit than you ever dreamed of.
It’s always a balancing act when we talk about risk and reward, and the perfect mix is different for everyone. You need to take some time and really think about what would be the right balance for you.
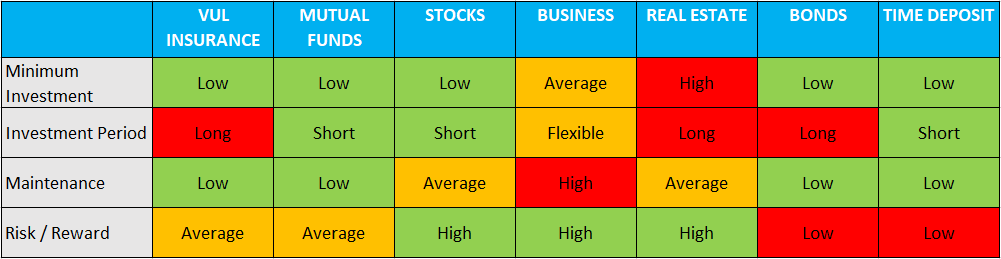
Main Investment Options in the Philippines
Here’s a table summarizing the main investments available in the Philippines, and what their characteristics are in relation to the four questions above.
If you find any of these interesting, then scroll down for more details.
VUL Insurance
VUL insurance plans are one of the most popular investment options in the Philippines. It’s a flexible and low-maintenance investment that hits three birds with one stone—life insurance, health insurance, and mutual funds. If you don’t have insurance yet, you should seriously consider getting VUL insurance.
Minimum Investment: VUL insurance plans are very flexible because they are personalized to your needs. You can have premiums that are as low as a couple thousand pesos per month. Just keep in mind that your benefits will be proportionate to the amount you invest.
Investment Period: Though there is some flexibility with VUL insurance, it’s best to aim for an investment period of at least 10 years. Most plans will deduct the largest fees in the first few years and let you invest for free by the 5th year or so.
Risk and Return: The risk profile and rate of return with VUL insurance is average overall, but can be adjusted based on your preference. Insurance companies usually have a few funds that cater to different risk profiles. Just make sure to get a good insurance agent so they can customize the best plan for you.
Recommended For: First-time investors who want an all-in-one package and don’t mind a long-term commitment
Mutual Funds
Mutual funds are another low-maintenance investment that is popular among Filipinos and especially working professionals. It has a lot of the same benefits as VUL insurance, but with two key differences: you won’t get any insurance (obviously) and you can think relatively more short-term. Put simply, mutual funds operate by pooling together money from many different investors and investing those in various assets and securities. That way it’s easier to diversify and manage risk.
Minimum Investment: Some mutual funds in the Philippines now have minimum investments as low as P5,000. The minimum investment will vary depending on which fund you’re looking at, but they’re all relatively low as far as investments go.
Investment Period: There is usually a lock-in period for mutual funds, though they can be as short as 90 days. You could even take out your investment earlier if you need to, but there will be a penalty. And of course as with any investment, you should think long-term if you want to see the biggest returns.
Risk and Return: Similar to VUL insurance, mutual funds have an average amount of risk and return. They can be higher or lower depending on the exact fund you choose, but professionally managed funds will be less risky than managing your own money.
Recommended For: Busy bees who just want to put their money somewhere where it can grow
Stocks
If you’re after bigger returns and don’t mind taking on a little more risk, then investing in stocks is a great way to go. It’s like the DIY counterpart to mutual funds. You’ll have to put more time and effort into managing your investment, but you’ll also have greater potential returns because you won’t have to pay any fund management fees.
Minimum Investment: Nowadays, you can open a stock trading account for as little as P2,500. Some brokerss won’t even require a minimum investment if you already have a savings account with their bank. Just keep in mind that, if you can afford it, we would still recommend start with at least P8,000. More on that here.
Investment Period: Stocks are very liquid investments, which means that it’s easy to sell, take your cash, and get out at any time. But keep in mind that even stocks require some time to earn substantial returns. There’s also a good chance that you will lose money if you need cash and have to sell your stocks at a loss. Always remember: Investments are not get-rich-quick schemes.
Risk and Return: Directly investing in stocks as an individual does carry more risk than VUL and mutual funds. Unlike professional fund managers, you won’t have a big corporation and fellow professionals helping you out. You’ll also have a smaller fund, which means you won’t be able to diversify your stock picks and manage risk as easily. Of course, the upside to all of this is that if you succeed, you’ll get to keep all the profits for yourself.
Recommended For: People who want bigger returns and are willing to dedicate time to managing their investment
Businesses
Minimum Investment: The initial investment for businesses varies a lot depending on the type of business you choose. It can be anywhere from a few thousand to a few million pesos. But whatever type of business you’re looking at, just remember that you’ll probably need enough cash to cover more than just the upfront cost. You’ll need to have enough money to cover costs for the first few months when your business may not be earning money yet. Not to mention, you’ll also need to invest a ton of time and effort if you want to give your business the chance to succeed.
Investment Period: It takes time for businesses to break even and earn a profit. While some only take a few months, others can take years. And either way, one thing’s for sure—there is no such thing as an overnight success. You’ll need to work hard and work consistently on building your business if you want any chance of seeing a return on your investment.
Risk and Return: A business is one of the riskiest investments you can make. It takes more work than any other investment, and even then a lot of businesses will fail within the first year of operations. But if you’re willing to take the risk, put in the work, and keep going despite the challenges, then your business could become a cash cow and the best investment you’ve ever made.
Recommended For: Strong-willed and self-motivated risk-takers who will do whatever it takes to succeed
Real Estate
There are two popular types of real estate investments in the Philippines—condos and land. There are some differences depending on which one you choose, but both don’t require that much maintenance and the potential return is quite high. If you can afford the high price tag, real estate might just be the right investment for you.
Minimum Investment: Depending on where the condo or piece of land is located, your cash out can be just a few hundred thousand pesos or a few million pesos. Compared to other options like stocks or mutual funds, you’ll definitely need to spend more money, but it could also pay off greatly.
Investment Period: With real estate, you can make money two ways: by renting out your property or through price appreciation. In both cases, it will take time for you to earn a profit. If you’re renting out a condo, you’ll likely have to hold on to your investment for at least 10 years before you recover your cost and start seeing returns. You could see returns faster if you’ve invested in land, but even this will depend heavily on the location of the land you’ve bought.
Risk and Return: Real estate is a high risk high reward type of investment. The initial cash out is very high compared to other investments, and it’s very difficult to sell if you suddenly need cash. Not to mention that even though the returns can be huge, they are not guaranteed. Investing in land is generally a bit safer than investing in a condo, but the demand for either can be unpredictable. Before investing in any property, make sure you do your research.
Recommended For: Seasoned investors looking to diversify their portfolio of assets and investments
Bonds
If you’re the conservative type of investor and don’t mind a lower rate of return, you can look into buying some bonds. When you buy bonds, you’ll know exactly how long you need to wait and you’ll also be guaranteed a certain rate of return. Just make sure that you can leave the money invested for the entire maturity period, because pulling out the investments early will mean losing money.
Minimum Investment: You can invest in retail treasury bonds (RTBs) for as low as P5,000, though many banks will require larger minimum investments. Because bonds have such low interest rates, then you may want to invest more if you can. That way, you’ll earn more actual pesos in profit.
Investment Period: Bonds will usually have longer investment periods that are a few years long, sometimes more. But the good thing is that you can find out the exact investment period upfront, even before you put out any money. Make sure you ask about the bond’s maturity date and that you won’t need the money before then.
Risk and Return: Both risk and return are very low for bonds, which is why they are recommended for conservative investors. Though your money won’t earn huge amounts of interest, at least you’re not likely to lose any money. At the very least, you’ll get an interest rate that’s higher than what you would get in a savings account.
Recommended For: Conservative and risk-averse investors whose main priority is not to lose money
Time Deposit
Time deposits are very similar to savings deposits, except that there is a specific date of maturity when you can take out your money. Because it’s such a low-risk investment, you can expect low returns as well. However, like bonds, this is another type of investment that will at least get you slightly more returns than a regular savings account.
Minimum Investment: The minimum investment for a time deposit can be as low as P1,000. But keep in mind that banks will usually give you a higher interest rate if you put in a larger investment.
Investment Period: The investment period for time deposits can also be very short—as short as 30 days. But again, keep in mind that banks will usually give you higher interest rates if you agree to a longer investment period.
Risk and Return: Time deposits usually have extremely low risk and extremely low returns. Some of them will have an interest rate that’s only 0.25% before tax—that’s the same as a regular savings account. But if you agree to a longer investment period or invest larger amounts of money then you can get a better interest rate. We recommend looking at other low-risk investment options too so you can decide if this is really the best option for you.
Recommended For: Extremely conservative investors who don’t have access to bonds or just prefer a more flexible low-risk investment
Conclusion
At the end of the day, anything that can make your money grow can be considered an investment. These definitely aren’t all the options, but we hope this helped you understand some of the most popular investments in the Philippines better. Only you can take this information and really look within yourself to find out what the best investment for you will be.
What are some of the best investments you’ve ever made? Let us know in the comments below!