Let’s give a round of applause to @tobi_ for being this week’s Featured Trader!
@tobi_ has been a member of the Investagrams community since Oct 2021 and has been very active as he has already posted a couple of times, always sharing his thoughts on views on some of his trades.
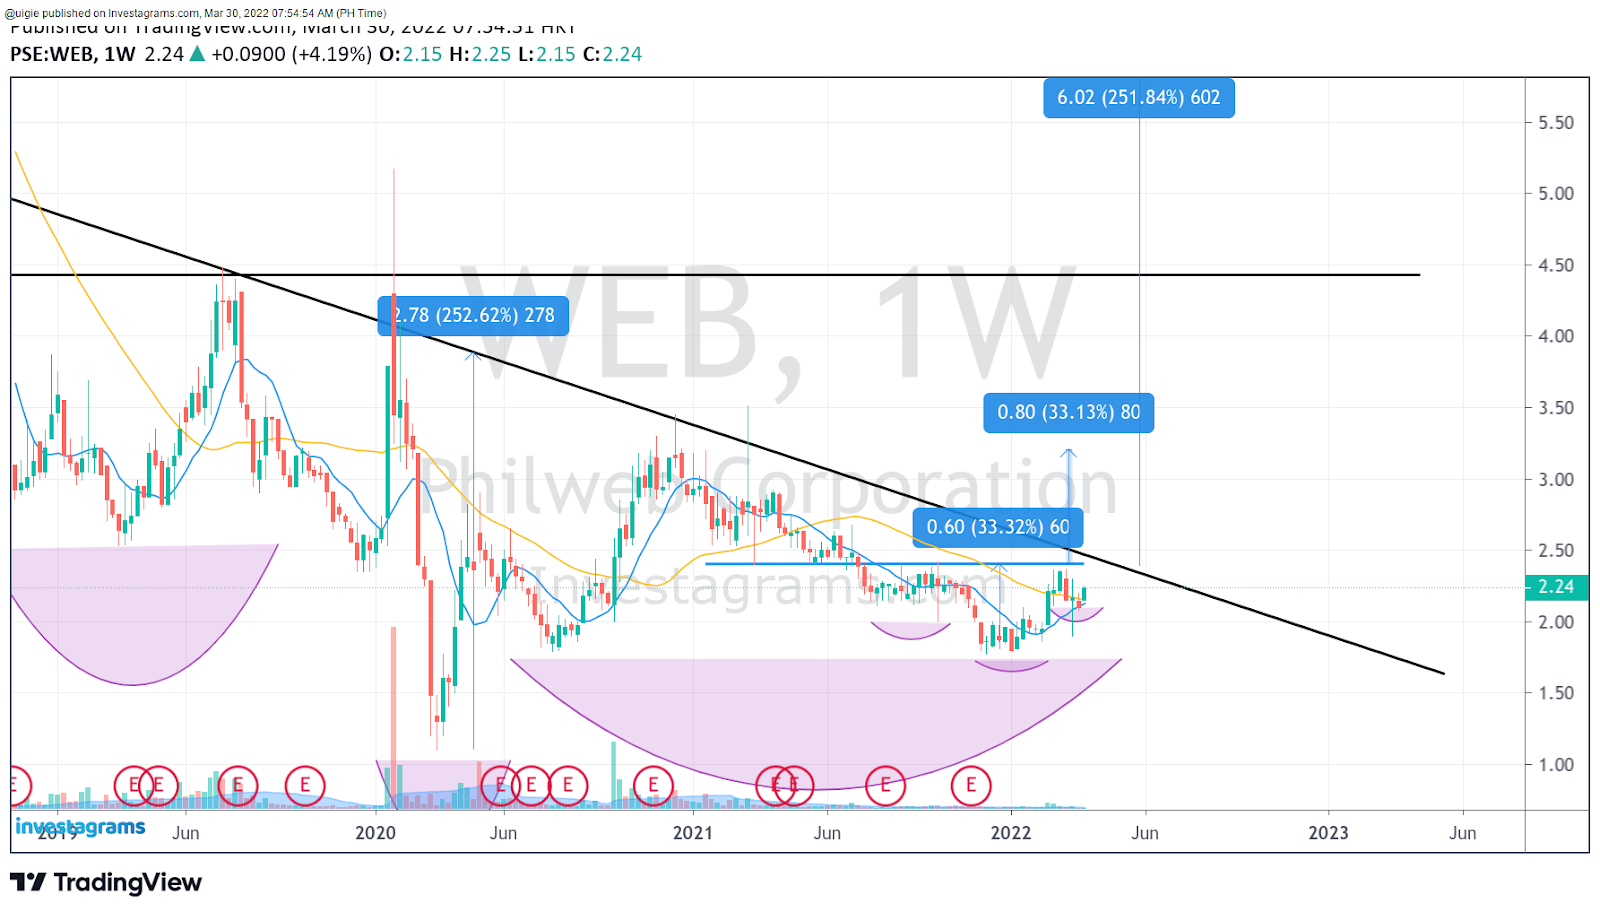
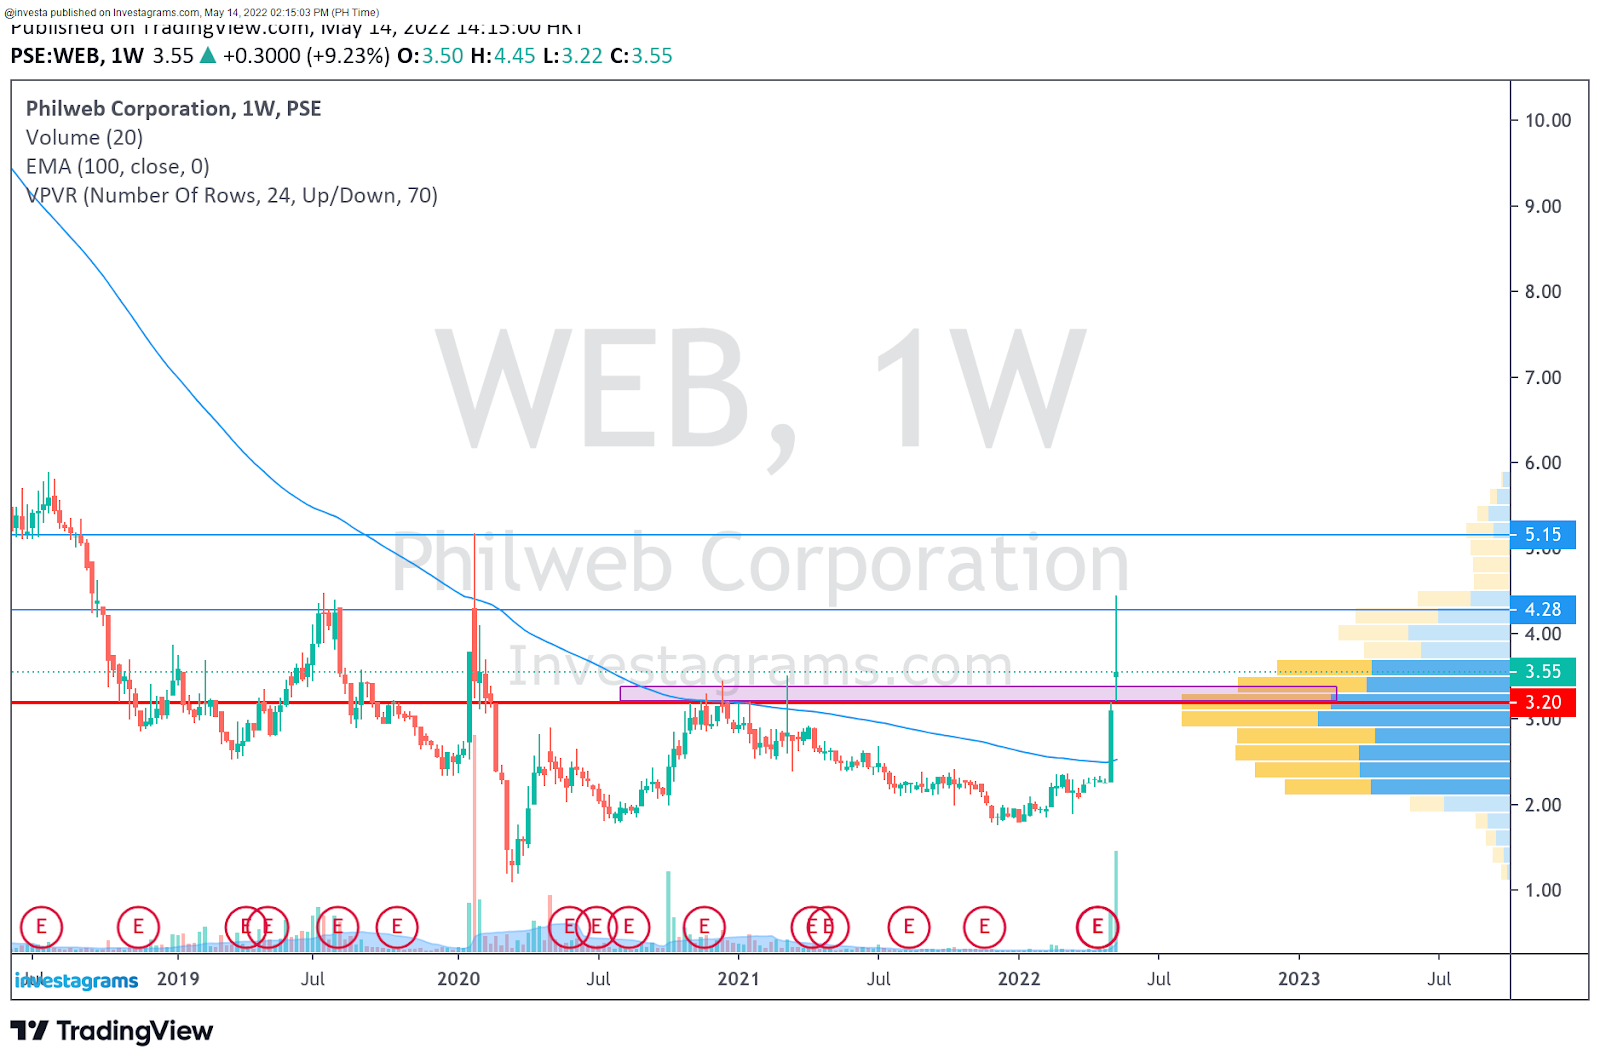
A few days ago, our featured trader posted his technical analysis in WEB. A hot stock in the local market recently, WEB has been on an uptrend and recently making new 52-wk highs!


As the stock was going up in uptrend, @Tobi_ looked for its support, as well as predicting ascending triangles on the chart that were bound for the breakout. @Tobi_ felt that this was a momentum stock for him to play. With that being said, he also considered the RSI pattern.
TECHNICALS OF THE TRADE
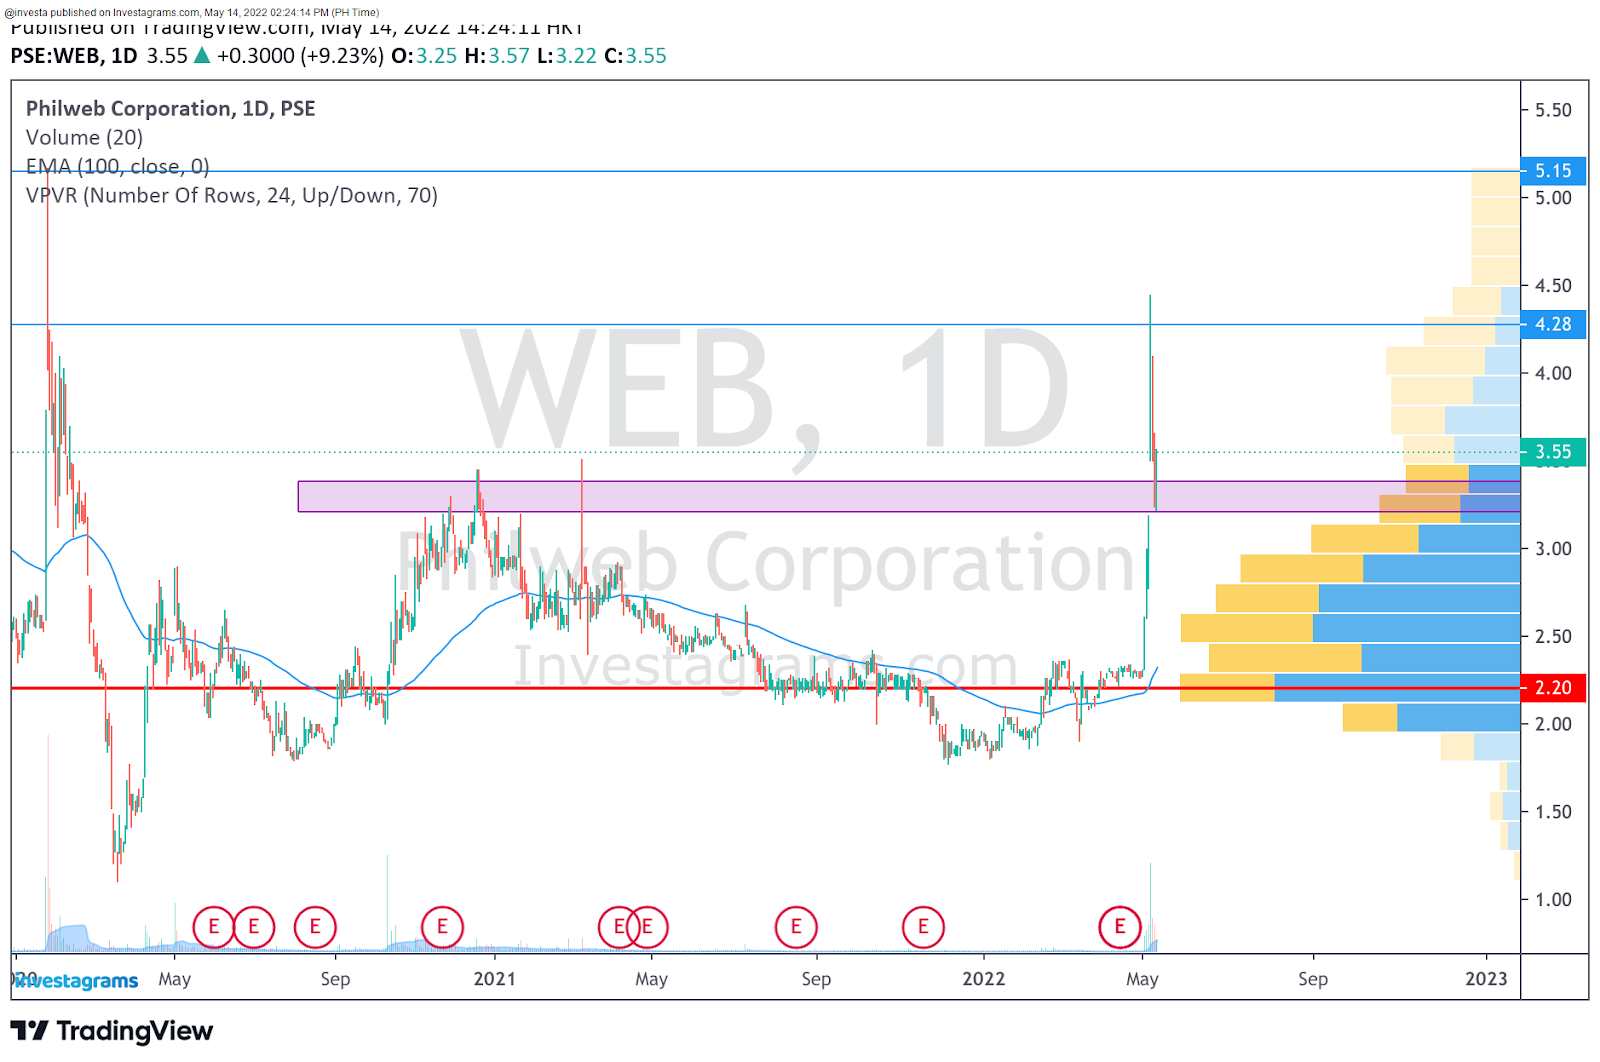
Technically speaking, WEB has proven to be a strong outlier in the Philippine Stock market. While others are falling and, on a consolidation, WEB has shown strength as it continues to move upwards strongly. It came from a breakout at 2.37 area before it surges to 4 level. Recently, there was a surge in the volume as WEB became more attractive to consumers. The stock recently reached its 52-week high at 4.74.
@Tobi_ is confident that prices will continue to rise as he predicted it is a good entry for a momentum play. Furthermore, there is great demand from the locals and foreigners.
FUNDAMENTAL CATALYST
PhilWeb Corporation is one of the leading gaming technology providers in the Asia Pacific Region as well being known for its diverse businesses. Despite the low net income, WEB has been speculative to the traders and investors. WEB is still unstable whether it will continue its trend or a speculative stock that is bound for another surge or dump. Further to that, it is best to observe the WEB and with consideration of the PSEi and the global market as it will rely on these stocks.
WHAT SHOULD BE MY NEXT MOVE
As the move has already happened, it would be wiser to observe and wait for what WEB might do next before buying in or riding-in with the wave of the stock. It is still unsure whether WEB will continue to rise or to follow its trend, so it’s best to wait for a consolidation or wait for a good entry near its support. Further to that, it would be advisable to trade lightly and in tranches in order to be cautious about your trades especially that the market is unstable and PSE is still relying on the global market, as well as news.
Once again, KUDOS to @tobi_ for being this week’s featured trader! Enjoy your 14-day InvestaPrime Access and continue to be an inspiration to the trading community.