Categories
Latest Posts

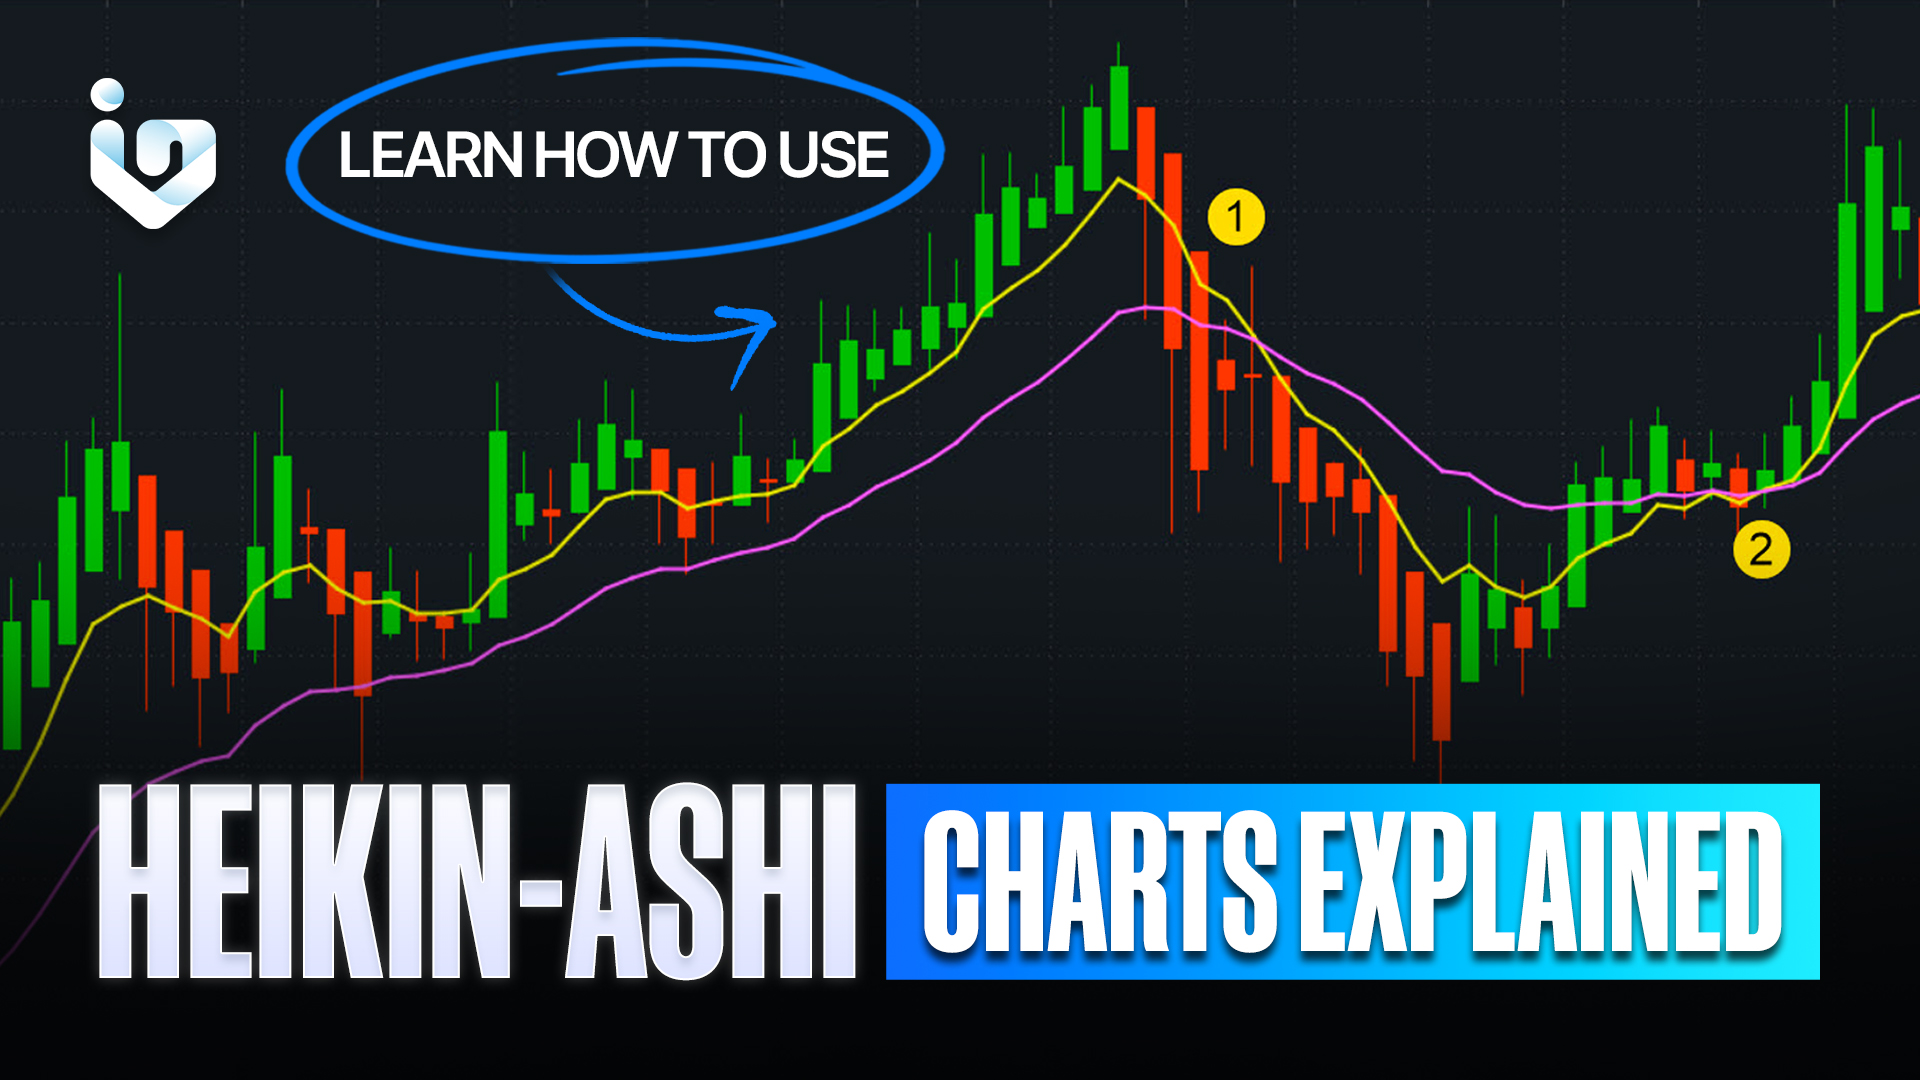
Heiken Ashi Charts Explained

In the world of trading, clarity and precision are paramount. Heiken Ashi charts, a Japanese technique, offer just that. These charts are a variant of the traditional candlestick charts and are prized for their ability to filter market noise. Let’s embark on a journey to understand them and how they can be a trader’s ally in the tumultuous seas of the stock market.

The Genesis

The term ‘Heiken Ashi’ means ‘average bar’ in Japanese. Developed to provide a clearer picture of market trends, these charts use average price data to create a smoother visual representation. This smoothing process helps traders identify the strength of trends and potential reversals with greater ease.

Anatomy of Heiken Ashi Candles

Unlike traditional candlesticks, each Heiken Ashi candle is calculated using a combination of current and past price data. The formulas for these candles are as follows:

  • Open: The midpoint of the previous candle (Open+Close)/2
  • Close: The average of the current period’s Open, Close, High, and Low (O+C+H+L)/4
  • High: The maximum of the current period’s High, or the current Open or Close
  • Low: The minimum of the current period’s Low, or the current Open or Close

These calculations result in candles that reflect the average price movements, smoothing out erratic fluctuations.

Interpreting the Candles

Heiken Ashi charts are particularly useful for identifying market trends. A series of green candles, with no lower shadows, indicates a strong uptrend. Conversely, red candles with no upper shadows suggest a strong downtrend. Traders watch for changes in candle color and the appearance of shadows to anticipate trend reversals.

The Strengths of Heiken Ashi

The primary advantage of Heiken Ashi charts is their simplicity. They transform erratic price movements into a smoother line, making it easier to spot trends. This can be particularly helpful in volatile markets, where traditional candlestick patterns may be obscured by price gaps and extreme movements.

The Limitations

While Heiken Ashi charts are powerful, they are not without limitations. Because they are based on average prices, there can be a lag in the representation of price movements. This means that swift market reversals might not be immediately apparent. Traders must use these charts in conjunction with other indicators to confirm trends and reversals.

Heiken Ashi in Practice

To effectively use them charts, traders should integrate them into their existing trading strategy. They work well with momentum indicators like the Relative Strength Index (RSI) or Moving Average Convergence Divergence (MACD). By combining these tools, traders can validate the signals.

Conclusion

Heiken Ashi charts are a valuable tool for traders seeking to reduce market noise and gain a clearer view of trends. While they should not be used in isolation, when combined with other indicators, they can provide a robust framework for making informed trading decisions. As with any trading tool, practice and experience are key to mastering this kind of chart.

In the dynamic dance of the markets, Heiken Ashi charts serve as a guiding light, helping traders navigate through the fog of price volatility. Embrace the simplicity and clarity they offer, and you may find your trading moves to a more harmonious rhythm.

Categories
Latest Posts

Featured Trader of the Week: @RomeTroy

Congratulations to @rometroy for being the featured trader of the week! Warren Buffet once said “Invest in companies you believe in.” In the case of @rometroy, he believes that his stock picks are not for short-term trading but a long-term HOLDING that will be profitable in the long run. 

@rometroy has been sharing his thoughts to the Investa community ever since 2015! He’s also a popular trader in the community as he has over 4000 followers.

A week ago, our featured trader posted his analysis on $SSP, a hot stock in the local market. $SSP recently reached a 52-wk high at 1.56 and closed at 1.5 on July 20, 2022!

As the stock recently surged through a reversal trend, @rometroy charted its support, resistance,  MA, EMA, and RSI on the chart, bound for a breakout as he believes in its fundamentals. @rometroy felt an opportunity to have a good entry near the support and HOLD for a while.

TECHNICALS OF THE TRADE

Technically, the $SSP reached a 52-wk high recently at 1.56 and is bound for consolidation or breakdown. After breaking out at the 1.18 level, SSP’s volume surges along with its RSI. The MA crosses the long-term length of 200. On the other hand, others are falling and consolidating. SSP is showing strength in terms of volume as it continues to consolidate after breaking out at 1.18ish. It came from a 52-wk low at the 0.92 area before surging and breaking the 1.18ish area. There could be a retest in the next few weeks in SSP. Technically speaking next resistance of SSP could face is the 1.6 level onwards. Furthermore, SSP will retest whether it will surge more or will be back being more bearish.

@rometroy was confident that prices would go up as he indicated in his chart the supports, resistances, MA, EMA, and the RSI. He charted a good entry near the support and possible resistance. He will also hold the SSP for awhile while planning for a take-profit price and his trades. 

FUNDAMENTAL CATALYST

SSP takes the spotlight in the local stock market, reaching a 52-wk high of 1.56 and closing at 1.5 on July 20, 2022! SFA Semicon Philippines Corporation is a semiconductor company that supplies Samsung Korea. SSPs are engaged in the assembly and test of memory chips and devices for computers, laptops, and servers, as well as micro SD cards for mobile phones. 

Furthermore, $SSP has been a trend recently, and the volume from the locals and foreigners is increasing. In addition, $SSP recently has a buy-back program which could be an indicator for a BUY SIGNAL. It is still unknown whether $SSP will push further or be back on track on the bearish side. Thus, it is best to observe $SSP and plan a good entry. In addition to that, semiconductors are facing higher demand. Thus, in terms of global, semiconductor chips are having shortages. Further to that, it is best to consider the market sentiment. In addition, consider the technical indicators and the financial statements as they are vital parts of the stock.

WHAT SHOULD BE MY NEXT MOVE

As the stock recently breakout from the 1.18ish area, it would be wiser to observe and wait for what $SSP might do next before riding in. In addition, this stock is wise for long-term holding since semiconductor stocks are increasing yearly. The demand from consumers is continuously surging in terms of data. However, it is still unsure whether $SSP will continue to go up, so it’s best to wait for a consolidation, pullback, or a good entry near its support for a better risk-to-reward trade. In addition, it is best to have alternative stock picks that are more profitable and good to trade alternatives like bottom picking stocks or stocks that could surge due to global demand or sectors that could be more profitable.  Furthermore, it would be advisable to trade lightly and in tranches.

Once again, KUDOS to @rometroy for being this week’s featured trader! Enjoy your 14-day InvestaPrime Access and continue to be an inspiration to the trading community.


Categories
Featured Latest Posts News & Features

Featured Trader of the Week: @gabrielo

Let’s give a round of applause to @gabrielo for being this week’s Featured Trader! 

@gabrielo has been a member of the Investagrams community since October 2017 and has been very active recently. He is always sharing his thoughts and his trades.

A week ago, our featured trader posted his technical analysis on $ABA, a hot stock in the local market. $ABA recently breakout and reached 52-wk highs at 1.67 ish!

As the stock is on an uptrend, @gabrielo charted its support, resistance,  MA, and Fibonacci Retracement level, and RSI on the chart that was bound for a breakout or breakdown. @gabrielo felt that this was an opportunity to have a good entry near the support and sell around the resistance.

TECHNICALS OF THE TRADE

Technically speaking, $ABA recently reached a 52-wk high and is bound for a much higher price or plunge of the stock price. After breakout at the 1.56 ish, ABA’s volume surges along with its RSI. While others are falling, $ABA is showing strength as it continues to move upwards strongly. It came from a breakout at the 1.56 area before surging to 1.60+ area onwards. There could be a retest in the next few weeks as ABA recently reached a 52-wk high. Technically speaking, the next resistance that ABA could face is the 1.8 level. Furthermore, ABA will retest whether it will surge more or a reversal after reaching the 52-wk high.

@gabrielo was confident that prices will further go up as he indicated in his chart the supports, resistances, and the trendline. He charted a good entry near the support and possible resistance to break. 

FUNDAMENTAL CATALYST

AbaCore Capital Holdings, Inc. has interests in the leasing of gaming equipment, gold and coal mining, real estate, and financial services. Furthermore, $ABA has been on an uptrend and the volume from the locals and foreigners is surging as well. It is still unknown whether $ABA will push further or reverse. In addition, ABA’s book value as of 1Q 2022 is 3.5 per share. Thus, it is best to observe $ABA before entering since it recently reached a 52-wk high. Further to that, it is best to consider the sentiment of the market, as well as the technical indicators and the financial statement before engaging in.

WHAT SHOULD BE MY NEXT MOVE

As the stock recently reached a 52-wk high, it would be wiser to observe and wait for what $ABA might do next before riding in. It is still unsure whether $ICT will continue to surge, so it’s best to wait for a consolidation, pullback or a good entry near its support for a better risk-to-reward trade. In addition, it is best to have alternative stock picks that are more profitable and good trade such as bottom picking stocks or stocks that could surge to due global demand.  Furthermore, it would be advisable to trade lightly and in tranches.

Once again, KUDOS to @gabrielo for being this week’s featured trader! Enjoy your 14-day InvestaPrime Access and continue to be an inspiration to the trading community.


Categories
Featured How to & Advice Latest Posts

Featured Trader of the Week: @tobi_

Let’s give a round of applause to @tobi_ for being this week’s Featured Trader! 

@tobi_ has been a member of the Investagrams community since Oct 2021 and has been very active as he has already posted a couple of times, always sharing his thoughts on views on some of his trades.

A few days ago, our featured trader posted his technical analysis in WEB. A hot stock in the local market recently, WEB has been on an uptrend and recently making new 52-wk highs! 

As the stock was going up in uptrend, @Tobi_ looked for its support, as well as predicting ascending triangles on the chart that were bound for the breakout. @Tobi_ felt that this was a momentum stock for him to play. With that being said, he also considered the RSI pattern.

TECHNICALS OF THE TRADE

Technically speaking, WEB has proven to be a strong outlier in the Philippine Stock market. While others are falling and, on a consolidation, WEB has shown strength as it continues to move upwards strongly. It came from a breakout at 2.37 area before it surges to 4 level. Recently, there was a surge in the volume as WEB became more attractive to consumers. The stock recently reached its 52-week high at 4.74. 

@Tobi_ is confident that prices will continue to rise as he predicted it is a good entry for a momentum play. Furthermore, there is great demand from the locals and foreigners.

FUNDAMENTAL CATALYST

PhilWeb Corporation is one of the leading gaming technology providers in the Asia Pacific Region as well being known for its diverse businesses. Despite the low net income, WEB has been speculative to the traders and investors. WEB is still unstable whether it will continue its trend or a speculative stock that is bound for another surge or dump. Further to that, it is best to observe the WEB and with consideration of the PSEi and the global market as it will rely on these stocks. 

WHAT SHOULD BE MY NEXT MOVE

As the move has already happened, it would be wiser to observe and wait for what WEB might do next before buying in or riding-in with the wave of the stock. It is still unsure whether WEB will continue to rise or to follow its trend, so it’s best to wait for a consolidation or wait for a good entry near its support. Further to that, it would be advisable to trade lightly and in tranches in order to be cautious about your trades especially that the market is unstable and PSE is still relying on the global market, as well as news. 

Once again, KUDOS to @tobi_ for being this week’s featured trader! Enjoy your 14-day InvestaPrime Access and continue to be an inspiration to the trading community.


Categories
Featured Latest Posts

Featured Trader of the Week: buMalo

Let’s give a round of applause to buMalo for being this week’s Featured Trader! 

buMalo is an active trader who has been with the Investagrams community since 2018. He is very active in the community and frequently shares his trades.

A few days ago, our featured trader posted his re-entry trade in ABA. A hot stock in the local market recently, ABA has been providing investors handsome returns as it has been making new 52-week highs. 

As the stock was going up, buMalo looked for a place to re-enter his position and found a small pocket as a chance to make a momentum play. He re-entered on the break of 1.42 as he felt that momentum was still strong for the stock. With RSI still being above 70, this is a good sign for momentum plays as it means there is still strong demand for the stock. 

TECHNICALS OF THE TRADE

Technically speaking, ABA has proven to be a strong outlier in the Philippine Stock market. While others are falling, it has shown strength as it continues to move upwards strongly. It came from its bottom near the 0.85 area and went into a frenzy once the long-term downtrend line was broken. Most of the consolidations were short-lived and rarely experienced strong downward volatility. The stock is currently looking to break the 1.56 and 1.88 levels, the next major resistances it has to take out in order to reach new all-time highs. 

buMalo is confident that prices will continue to rise as different momentum indicators are still pointing upwards, in addition to Net Foreign Buying still going strong.

FUNDAMENTAL CATALYSTS

AbaCore is a holdings company that owns subsidiaries involved in Finance, Real Estate, Gold mining operations, and Coal mining operations. Despite earnings still not yet near pre-pandemic levels, investors are eager that the company is going to turn its situation around as the company itself has announced that it will be distributing dividends again, and will even add in shares from one of its subsidiaries – PRIDE. The market has taken this as a good sign, and demand has picked up for the stock pushing it to higher prices. 

WHAT SHOULD BE MY NEXT MOVE?

As the move has already happened, it would be wiser to wait for what ABA might do next before buying into the stock. It is still unknown whether the stock will continue to rise to higher levels or not, so it’s best to wait for a consolidation in order to look for a better risk to reward trade. As the local equities market is still facing the same major problems, it would be advisable to trade lightly should you ever want to participate in ABA, especially if you haven’t established a base at lower levels. 

Once again, KUDOS to Bibam for being this week’s Featured Trader! Enjoy your 14-day InvestaPrime Access and continue to be an inspiration to the trading community.


Categories
Featured How to & Advice Latest Posts

InvestaU and Chill

No matter the field that we’re in, everyone needs some time off to relax and unwind. The weekends are the perfect time to do so since we don’t have to worry about work. It is fine and recommended to just enjoy ourselves. However, it doesn’t hurt to be a little bit productive for the weekend as well. So, why not do both – a relaxing activity that still lets us be productive. 

Just head on over to Investa University to go over our selection! We offer free videos, but subscribing to InvestaPrime lets you have access to a wider range of content. You’ll be able to browse through all of our premium learning videos and will have access to all of them once you’re subscribed. 

Watching webinars and masterclasses might not be the first thing you think about when you want to have fun. But, they can still be relaxing if you’re open to the idea!

  1. How to look for content that’s right for you

Once you’re at Investa University, you can browse through different catalogs to find the topics you’re interested in.

But, if you don’t have a specific topic in mind yet, you can scroll down over and view some of the featured lessons! You’ll see featured videos that were the most popular, the most recently uploaded, and other differentiations that help you find something to watch.

  1. Friday date nights

Technically not a weekend, people still consider Friday nights part of “the weekend” as it’s the start of our weekly mini-vacation from work. Those who are lucky to have a significant other often treat the end of Fridays as a special time they can spend on dates. If ever you’re sick of drinking out, spending a lot of money at restaurants, or just want to stay home and do something together, watching Investa University Premium content together can be something you can put on your list of date ideas!

You both don’t need to be traders to enjoy these videos. There is a wide variety of topics, from trading and investing to businesses! The speakers are really fun to watch and listen to, really making it a fun activity to do. 

  1. Weekend reading substitute

People who want to become better versions of themselves often like to read books. Although it should be a daily habit, the majority tend to do most of their reading on the weekends as it lets them have more time to do so. If you’re not in the mood to read, but still want to learn, you can head on over to our learning platform!

From trading lessons

Personal Finance

Even business lessons and more!

We still recommend everyone to get into the habit of reading, but we also made the Investa University Premium content as learning supplements for everyone who would also like to consume educational content in video format. 

  1. Access to exclusive webinars

Aside from recordings, having access to Investa University Premium content through an InvestaPrime subscription will also let you join in our exclusive live webinars with well-renowned traders from around the world!

​​

More than just watching their presentations, you can join in as well and ask them your questions during the live event!

Again, we offer free videos that everyone can access. However, subscribing to InvestaPrime will let you gain access to premium learnings from Investa University along with future live events. If you’re looking for a platform to learn more about trading, finance, business, and even personal development, check ​​Investa University out!

Aside from premium Investa University content, having an InvestaPrime subscription lets you gain access to a lot of other powerful tools and educational material that can help you progress no matter your current skill level. Want to know more about what we offer? Head on over to the InvestaPrime landing page to look at all the features that we provide to our subscribers!


Categories
Featured How to & Advice Latest Posts News & Features

Featured Trader of the Week: HULYO

Let’s give a round of applause to HULYO for being this week’s Featured Trader! 

HULYO has been a member of the Investagrams community since 2020 and has been an active member of our community. Along with being an IT automation engineer, HULYO also actively trades and is very interactive with other traders.

A few days ago, our featured trader posted his thoughts for PSE:SCC. One of the stronger stocks in the local markets recently, SCC mainly operates through the production and sale of coal. 

Amidst the poor market conditions, HULYO still looks for opportunities, and one of the opportunities spotted was PSE:SCC. As PSE:SCC rose from its bottom, it wasn’t safe from market drawdowns as shareholders experienced sell-offs. However, it is still noticeable that the uptrend is still intact, and the stock appears to have formed a continuation pattern. 

TECHNICAL STANDPOINT

In terms of price action, PSE:SCC is in a clear uptrend despite the rough market conditions. Without making anything too complex, higher highs and higher lows are continually being established. It isn’t in the strongest of uptrends as drawdowns from the tops are wide, but the fact that it still is in an upward general direction while others are falling isn’t something to take lightly. As with what HULYO mentions in his post, the recent breakout could signal that it is receiving enough demand to boost it towards higher targets. One of the biggest supply areas that it needs to take out would be around the 40 area, with the next one being its ATH level of 50.

FUNDAMENTAL STANDPOINT

PSE:SCC focuses mainly on coal production. With coal prices rising rapidly in the commodities market due to supply disruptions, PSE:SCC stands to benefit from increased margins as they will be able to sell their inventories at higher prices. Although the shift toward renewable energy has started, coal is expected to remain one of the sources of energy production for the next few years. It is forecasted that coal prices will stay elevated for a foreseeable future. 

What should be my next step?

As we have constantly been mentioning, the current market environment is not suitable for newbie traders. Even though PSE:SCC has been strong thus far, shareholders will still most likely experience a lot of volatility. There will be a lot more opportunities later on not just in this stock, but in others as well. However, should you want to trade PSE:SCC it would be more advisable to wait for retracements and to keep your positions light. Risk management becomes even more essential during bad market conditions like the one we are experiencing now. 

Once again, KUDOS to HULYO for being this week’s Featured Trader! Enjoy your 14-day InvestaPrime Access and continue to be an inspiration to the trading community.


Subscribe to our Newsletter

Join our mailing list for investing tips and stock market advice
to help you reach your first million.

You have Successfully Subscribed!