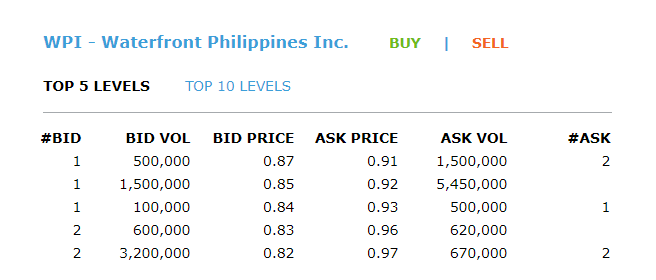
Rinse-and-repeat trading abuses is where a trader capitalizes on the wide spread of a stock.
For example: $WPI .87 bid, .91 offer — a trader just buys and sells repeatedly in the virtual trading platform and takes advantage of the illiquid stock and its wide spread.
In the real markets, you can barely trade these situations because you need to queue your volume. Meaning, you run the risk of not having your order filled since the stock is barely trading, or much worse, you could be trapped in an illiquid stock.
On the other hand, in any virtual trading system, anyone can just go maximum allocation and buy/sell repeatedly since there is no queue, and you can exit any time — which does not represent real markets. In real market situations, you won’t be able to trade this consistently with significant volume, which is why we do not find this strategy as realistic
This kind of stock behavior depicts an unrealistic strategy and it is often abuse-able in virtual trading competitions.
We iterate that any player who is constantly getting his/her profits from rinse-and-repeat wide spread and illiquid trades will flagged and be disqualified. We will be able to validate this through our algorithms that verify the trading history of each participant.
We understand that scalping is a form of strategy, but it is barely applicable in the Philippines especially given the high commissions and the inability to go-in-and-out consistently due to the lack of liquidity and risk of wide spread stocks that suddenly become inactive and illiquid. Day-trading stocks that have real moves and liquidity are OK, but those who are just looking to repeatedly abuse stocks that are barely trading (widespreads) and are illiquid will be DISQUALIFIED.
As we have said, we will have no TOLERANCE to traders who are abusing illiquid stocks and rinse-repeat abuses.
We have observed that there are still a lot of traders mainly profiting from illiquid stocks and repeatedly doing rinse and repeat strategies. We have given our warning earlier to some of you. Our algorithms and our team has detected several players who continue to abuse and rely mainly on ‘rinse-repeat’ spread abuse trades. We have been very consistent in iterating to you that RINSE-REPEAT, unrealistic and abusive trading strategies will be penalized and will not be TOLERATED in this competition.
What are “abusive” trades?
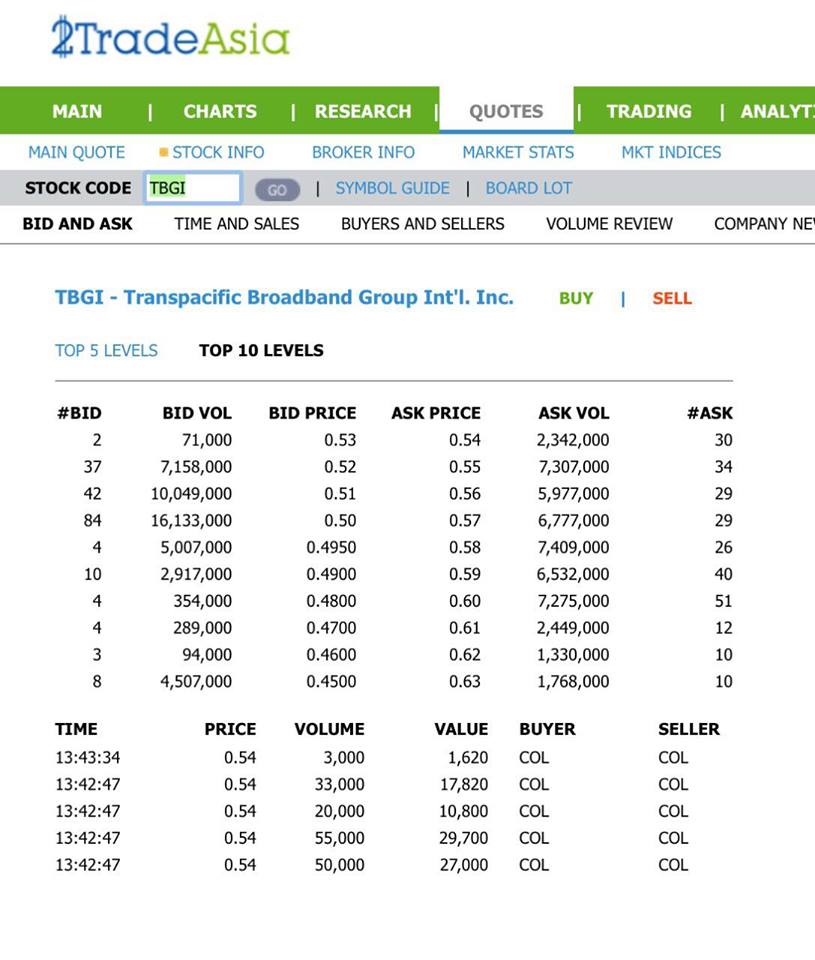
Example 1: TBGI
Look at the Bid and Ask Table Below.
Some of the Traders may Opt to Buy the Stock (in the Competition) at 0.53, Sell it at 0.54 and in just a few minutes, gain around 1.5+% in profits per trade. This is nearly impossible and takes a huge amount of Time once done in Real Life because you have to wait for your order to be filled first.
We want to find winners who show TRUE skill and strategy.
They say the best way to learn something is through experience!
Today we present to you another GREAT OPPORTUNITY to hone your trading skills, while getting the chance to compete and win AWESOME PRIZES.
Welcome to the second year of Investagrams Trading League!
The Investagrams Trading League is a mini-stock competition that runs for 3-weeks.
The winners of this competition will receive cash prizes!
How to WIN the Investagrams Trading League?
The goal of this trading game is simple. Find opportunities and trade your best to gain the most profit and have the highest total account
value at the end of two trading weeks!
WINNERS and PRIZES
The top three (3) players with the highest account value at the end of the trading round will be heralded as the winners.
Each winner will receive a corresponding cash prize from:
1st Place: Php 3,000
2nd Place: Php 2,000
3rd Place: Php 1,000
MECHANICS
For this competition, trading will begin on August 20 and ends on September 14, 2018
1. Trading is done through the Investagrams Virtual Trading Platform.
2. All ports will be reset for the competition.
3. Participants will start with Php 100,000 virtual money to trade. Learn how to use the virtual trading platform here: http://invs.st/VirtualTrading
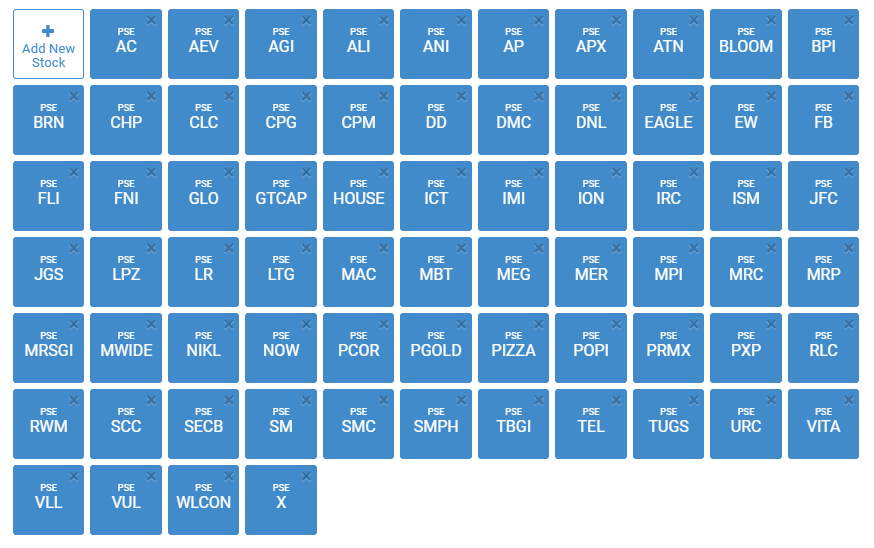
4. You can only trade liquid and actively trading stocks, we have filtered out which stocks fit this criteria. We have taken out illiquid names that have wide spreads and can be easily abused such as OV, AR, OPM, etc. The whole stock list may be accessed once you are accepted in the competition. See List of Stocks Below.
5. You can only allocate a maximum of 33% of your portfolio on any single stock at a time. No ALL-ins!
6. There is a 10-minute trading lock after any transaction. This means you need to wait for 10-minutes before you are able to sell your position. This will prevent any scalping abusers in the competition.
7. At any point during the competition, Investagrams has the rights to modify certain rules and mechanics if they see it fit. These adjustments are done to nullify any abuses or loopholes on the trading game. Let’s keep it fair and fun for everyone. We want the winners to be truly deserving.
8. Any cheaters and abusers shall be flagged and be given corresponding repercussions.
9. Trading Hours: Weekdays from 9:30AM – 12:00PM and from 1:30PM-3:30PM (Same trading hours with the real PH Market. Meaning, you can’t trade during off hours and on weekends.)
Let’s keep it fun and fair for everyone, please do not flood the system with many entries.
Let’s be honest, so we can have a real gauge of how we fare in the competition!
REGISTRATION
To register, you must already have an Investagrams account. If you don’t have one yet you can sign up here. www.investagrams.com
You can input the Organization you want to represent (Optional). Then click the JOIN button!
You may join until Monday — August 20, 8:45 AM. Everyone will be accepted in the trading lobby, by August 20, so no need to worry.
We will send you a notification once you are accepted in the trading lobby and once the competition is about to begin.
Don’t forget to log-in your accounts once the trading starts!
In Investagrams Trading League, you get a chance to learn, have fun and compete all at the same time! You also get to win awesome PRIZES to boost your stock market journey!
I failed more than a dozen times in college and I thought my life was over, until the day I earned my first few pesos from trading the Stock Market—my first stock was Ayala Land by the way.
Here in the Philippines, we are taught that going to a reputable university and being a good student are the only ways to land a great career and be financially free. While this can be true at times, the current status of most young adults in our country says otherwise.
You know why? Because the number of graduates doesn’t match the number of employees needed by corporations. The reality is you have to compete with other fresh graduates or worse, those that already have work experience. How can someone who doesn’t have any experience compete with someone who are already tenured?
This is also the reason why I LOVE the Stock Market. First of all, it doesn’t care about YOU, your Educational Status, the amount of Money you have, or even your Connections.
Everyone is in equal footing when it comes to STOCKS and those who work hard consistently and put their focus on things that truly matter wins.
2. You won’t succeed if you don’t take calculated risks.
Remember the word “CALCULATED.”
Someone once said, “A ship is safe in the harbor, but that is not what ships are built for.”
If you see the stock market like a casino, it will treat you as a gambler; but if you treat it as a great source of wealth, it will give you what you work and sweat for. I’m not saying that you should start investing your life savings and, in a few days, expect to become a millionaire. It doesn’t work that way. Every one of us has different risk profile and risk appetite: Younger people can be more aggressive than those who are older, a single person can take more risks than a married person… AND GUESS WHAT? THAT’S PERFECTLY FINE!
No matter how early or late you start, if you put your focus on mastering risk and analyzing companies, YOU CAN STILL BE SUCCESSFUL in this field.
I’m not pushing you to invest in stocks and change your life if you are happy and contented to with what you’re currently doing. If you’re happy with the path you’re on, keep going and ever stop! But if you think the stock market might be the path for you, why not give it a try? The stock market is a great avenue for you to build wealth and have more time for the things that truly matter. Start planting seeds today because sometimes before you know it, it’s too late.
Seeds can be destroyed by the storm, scorched by the heat of the sun, or inundated by the flood. YOU MUST PROTECT YOUR SEED because a Fruit Bearing Tree that can feed your family is 100% worth the Risk.
3. Money is a tool, but it alone won’t make you happy.
Money is a tool, but it won’t make you happy—but it can buy you time which you can use to be with the people you love, travel to places you’ve never been, ride a jetski, ride a helicopter, experience skydiving, and live without the anxiety that tends to come every time it’s time to pay the bills. Do you get what I’m saying here?
The truth is, the LACK of money will not make you happy as well. In fact, it will likely make you miserable and unable to enjoy the better things in life.
Money in itself won’t make us happy, but the THINGS we buy, the EXPERIENCES we share, the SECURITY we give our family, and the TIME we spent to fulfill our Purpose and Calling. That is true happiness.
“and above all our dreams and aspirations, we should also remember to use money to love people and not use people just because we love money. “
4. You can, but only if you will.
YOU CAN achieve whatever you want in this world if YOU WILL start putting in the work.
YOU CAN be a better person if YOU WILL take failures as lessons.
YOU CAN master any craft that you want to master if YOU WILL focus on building your skills and talents.
YOU CAN reach greater heights if YOU WILL be willing to give up the good for the best.
YOU CAN make a change in your country if YOU WILL make time to change and improve yourself.
YOU CAN be what you want to be if YOU WILL be willing to write your own destiny.
YOU CAN do the impossible if YOU WILL decide to take on the challenge.
YOU CAN only if YOU WILL.
5. Money is never the end goal.
The true goal is to reach a point when you can say to yourself: You’ve finally made it! You’ve finished the race, fought the good fight, and made an impact on the people around you.
This is also the reason why we started Investagrams. We wanted to share how investing can change your life and the lives of the people under your influence. We wanted to cause a ripple effect strong enough to influence more Filipinos here and abroad.
Thank you for taking the time to read this article. I’m really hoping that this will help and inspire you to find your purpose, reach your dreams, and fulfill your calling.
One last thing…
If you want to take that first step towards financial freedom but don’t know where to start, we’ll be having an event this coming April28in SMX Convention Center MOA! The event is called InspirePH. We’ve gathered some of the BESTPEOPLE from different industries such as the STOCK MARKET, STARTUPS & BUSINESS, and even DIGITALCURRENCY to share not just their story but also their mistakes, their motivations, and how they were able to succeed in their respective fields.
Just like you, a lot of the participants want to make that decision to strive towards being financially free. Take this chance to MEET PEOPLE and NETWORK, who knows? Your new business partner might just be around the halls of SMX!
For only PHP1,999 for InvestagramsMembers (You can register for free at www.investagrams.com), you can that first step to learn the ins and outs of Trading the Stock Market, Building your own Startup or Business, and even using different Digital Currencies. From having ZERO idea about the topics, you can jumpstart your way to EARN from these vehicles!
The Philippines is a great country to investin, that’s why most foreigners choose our country for their businesses and investments. But the SAD REALITY is that most of the benefits go to the rich and the foreigners who took the risk of investing. Meanwhile, only less than 1% of Filipinos are invested in the Stock Market.
Don’t you believe in the potential of the Philippines? Don’t you want to be part of this growth?
EIGHTDays left and FEW SEATS remaining for this event.
Be part of the 1%, get your tickets at www.inspire.ph and make it happen!
*All the proceeds for INSPIRE PH will be used for the IMPROVEMENT of our platform. It will also FUEL our MISSION to make more Filipinos here and abroad financially free!
Last January 20 marked the culminating event of Investagrams’ first major competition—the Investagrams Trading Cup 2017—and the turnout was absolutely incredible! Our hearts are truly overflowing and we are sincerely thankful for all the support from newbies, experienced traders, and even masters of the market.
We created the Investagrams Trading Cup to provide a fun avenue where everyone could showcase and improve their trading skills, but the turnout was more than anything we could have imagined. The competition was intense and we were amazed by the caliber of traders that came out on top.
Out of the almost 2000 traders who joined the competition, those who led the pack were truly inspiring and extremely generous in sharing their wisdom and experiences. Here are just 10 lessons out of the hundreds we learned from the Trading Cup 2017’s top 10 players.
#10
@joelduque: Work smarter, not harder.
Joel duque is the living proof that you don’t have to trade actively to earn significant profits. Through proper filtering, he was able to handpick stocks that had great potential and allowed him to bag the top 10 spot.
#9
@tris0314: Always be learning—from others and from yourself.
Tristran Montano shared his most significant trades throughout the competition, and highlighted the importance of learning continuously if you want to achieve success. He learns from various online blogs, websites, and his own history of trades.
#8
@MoneyGrowersPH: It’s never too late.
Despite lagging in the competition early on, he kept his composure and his winning attitude. In the end MoneyGrowersPH was able to rise up and prove that he indeed is one of the top traders.
#7
@Smalltime: There’s always a way to make it work.
Richard Baco is an OFW based in the Middle East. Despite holding down a full-time job, being in a different country, and even being in a different time zone, he still found a way to get the top 7 spot. He even gave a recorded video presentation since he couldn’t fly home for the culminating event.
#6
@Junster: Quality is more important than quantity.
You don’t have to have tons of trades to be profitable. In life and in trading, quality is almost always more important than quantity. When executing your trades, Joseph gave us these words of wisdom: Losing is inevitable. It’s part of the game. Just remember that you can win small, win big, lose small, but never lose big.
#5
@chad3ie: Focus on what’s really important.
Chad is one of the best traders of Citisecurities and a teacher in the Caylum Trading Institute. Aside from sharing some of his best tips, for life and trading, he reminded us of what’s really important—at the end of the day, what (or who) is it that we are trading for?
#4
@Scraffycoco: You can achieve your dreams at any age.
Rafael won 6th place in the Investagrams Stock Market Challenge last 2016 and has always dreamt of sharing his passion with a larger audience. Despite his young age, he proved that age is not a measure of mastery, and that with hard work and passion you can compete even at the highest level.
#3
@zeefreaks: It’s a jungle out there, but you can conquer it.
The mysterious head of the Zeefreaks Tribe and definitely a deserving leader in terms of skills and passion. During the competition, he proved to everyone that he is indeed one of the best traders in the Philippines. He shared his insights on how he studies and understands his prey before striking at the precise moment to capture the most profits.
#1
@bobbyaxelrod: There are always opportunities. You just have to know how to find them.
Edu bagged the most profits in the competition through his skills in finding momentum based trading opportunities. He shared simple but incredibly powerful tips for how he makes the most of the opportunities in the market.
#1
@Taylor: Above everything else, commitment is key.
One of the few masters of Elliot Wave here in the country, Javi used the Elliot Wave together with set-up based trading to consistently find great opportunities in the market. Through years of sharpening his trading style and skills, he was able to become a master trader and the champion of the Investagrams Trading Cup 2017.
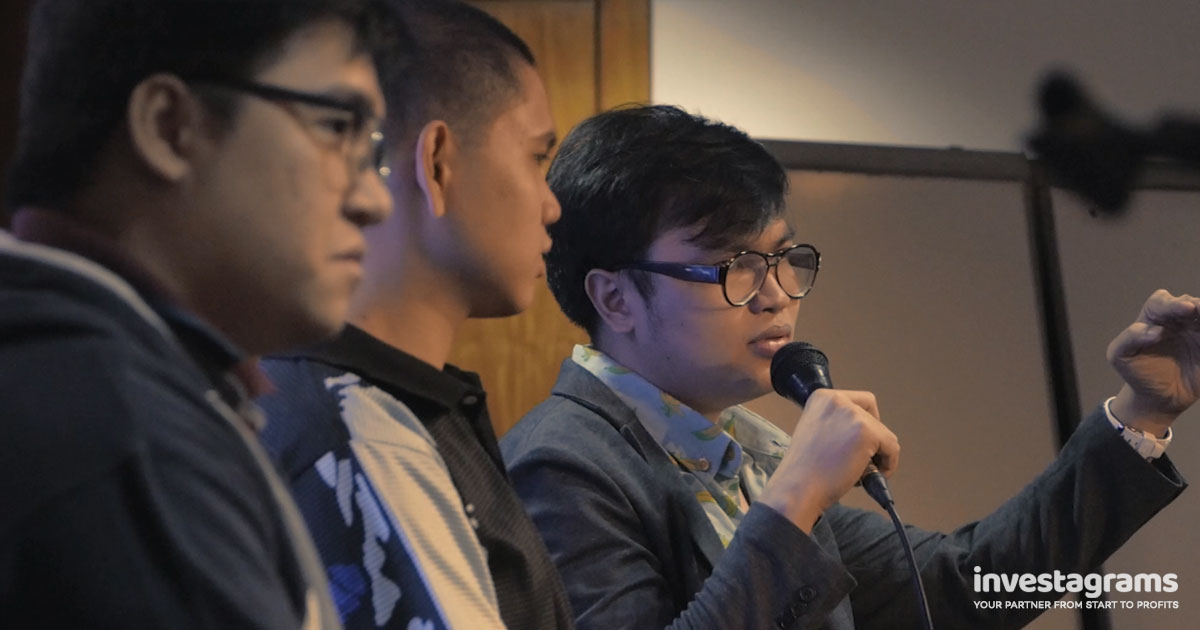
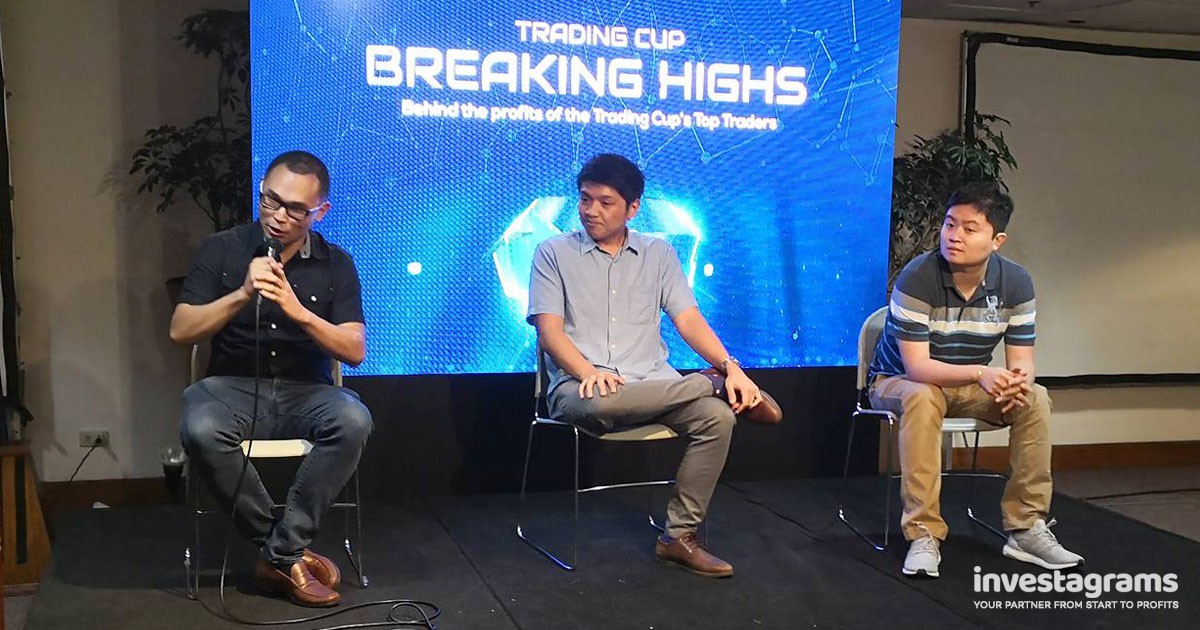
These guys presented their strategies and trading tips in our Breaking Highs event last Jan 20, and even those of us who are experienced traders still learned a lot from them.
For those who weren’t able to attend, don’t worry! You can still watch the FULL VIDEO of all presentations and discussions. Click here to get access.
First of all, we would like to congratulate each and every one of the participants in the Investagrams Trading Cup 2017! Not only have we opened up a fun avenue for both beginners and experts to improve their skills, we have also made history in our country making this the BIGGEST stock trading competition to date in the Philippines.
We’ve had a very intense competition these past few months, which was led by two great traders in the top spot—BobbyAxel Rod and Taylor. They whizzed past the rest of the pack, with each of them turning their PHP 100,000 virtual portfolios into PHP 364,160.13 and PHP 354,225.97 respectively. Only a tight margin of around 3% separates these two competitors—both superb performances for sure.
We want to share with you however, that there were certain concerns brought up to us during the span of the competition regarding the trading of illiquid stocks. As many of you know, part of our rules are protection measures against typical rinse-and-repeat trading methods that are not applicable in the real market. Because of this, we previously sent out warnings and communications to all players so that we keep the integrity of the competition intact. Our goal here was to emphasize the importance of applying strategies that are realistic and applicable in the PSE.
But we realized during the competition that since our virtual trading platform is not yet as perfect as we would like it to be, there were some opportunities in the competition that were not perfectly in sync with those in real life. That is not to say that these opportunities were unrealistic altogether, but there were some disputable trades that came up. Admittedly on our part, we also understand that we could have done a better job defining which trades would be considered valid and which ones would not be allowed. This is something we will definitely improve for the next competitions.
In an effort to maintain the fairness and integrity in this situation, we reviewed all of the top players’ trades. During this review, we saw that a certain degree of illiquid trades are really unavoidable due to the sudden and often inevitable inactivity of some stocks—whether due to general liquidity or because of the holiday season last December. In line with the concerns raised, we revisited the standings of the top players assuming all remotely illiquid trades were removed. After doing this, we found that even after taking out all the profits from illiquid situations among top 10, the standings still remain the same with Taylor and BobbyAxel Rod still claiming the top 2 spots, except with their rankings switched.
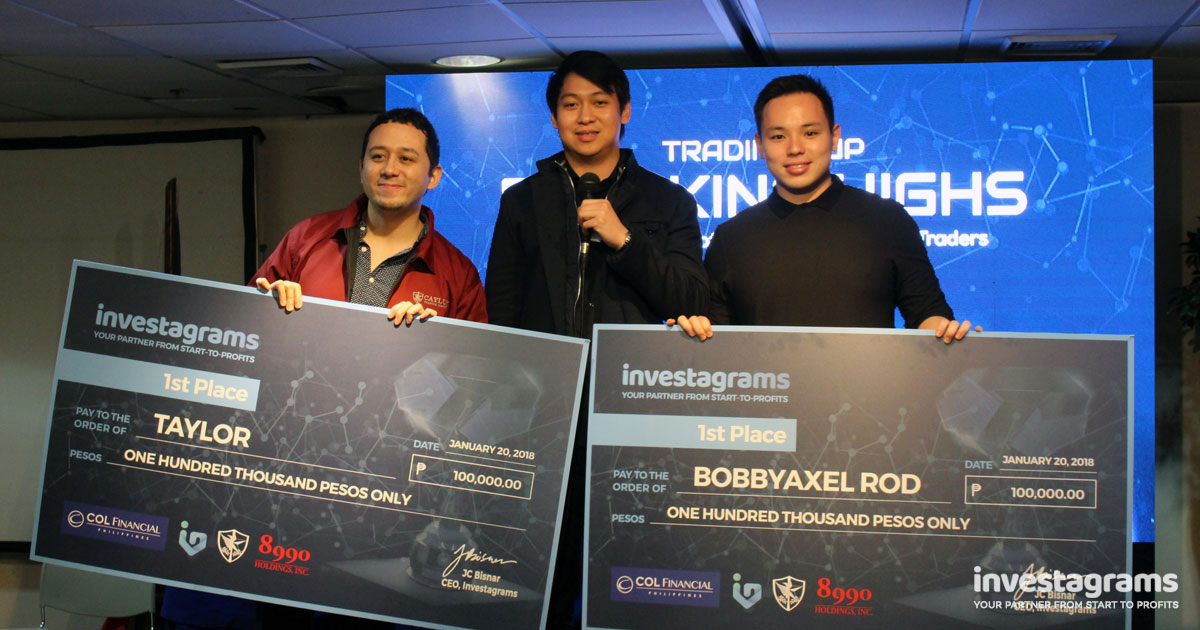
We have discussed this issue with both BobbyAxel Rod and Taylor in great detail over the past couple of weeks. After taking into account all of the issues that were brought up, and seeing how both of these traders have performed and competed with their best effort, our team has decided that the fairest thing to do is to award them BOTH with the 1st prize of PHP 100,000 and the travel package.
In addition, both contenders have also agreed to help us keep the essence of Investagrams Trading Cup by proceeding to a CHAMPIONSHIP ROUND!
On January 20, both BobbyAxel Rod and Taylor will present their strategies and defend in front of an external panel composed of different professionals from the industry. They will be graded by the panel based on metrics such as Strategy, Risk Management, Execution, Comprehensiveness of Defense, and more. These will compose of 90% of their score. However, 10% of the scoring will be based on the Audience’s Vote—to also take into consideration the view of our community.
Both of them have shown immense trading skills, both of them are first prize winners, but only one of them will be the CHAMPION and win the Investagrams Trading CUP! An exciting match ahead, see you on January 20!
Everyone has those off days. Everyone has failures and doubts. What’s important is that we keep going even when it gets hard—especially when it gets hard. Because that’s when you know you’re getting close.
So if you’re feeling down, ere are a few tried and tested principles that will help motivate and inspire you.
1. Give yourself time.
Success takes time. Building an empire takes time. “Overnight successes” like PokemonGo or even the biggest breakouts you’ve seen took years before finally breaking through that glass ceiling.
Trying to achieve success as fast and as aggressively as possible is great, but you need to be in it for the long haul. Take time to recharge and take care of yourself. You’ll be happier and more productive for it. Not to mention you’ll be able to outlast any challenges that may come your way.
2. Be humble and take things one step at a time.
Just a little bit of success, a 5% gain for example, can make us feel invincible—like we can do anything and nothing can bring us down. Don’t fall into this trap.
Whatever amount of success you achieve, know that there is always room to improve. Don’t be impulsive, thinking that you’ll always be right. In other words, ‘wag mag-assume. Bad ‘yun.
Remember that success can fade as easily as it comes and know that it can all be taken away at any time. Work hard so you can stay successful.
3. Don’t be afraid to take risks—but don’t be impulsive either.
By now, you’ve probably already heard of the saying, “High risk, high reward.” Yes, you shouldn’t be afraid to take risks, because you won’t gain much by always playing it safe.
But while that is true, it seems that most people nowadays have the opposite problem—they impulsively take too much risk. Notice that we used the word “impulsively”. This is because the main problem is not that people are taking large amounts of risk. The problem is that people are taking large amounts of risk without knowing what they’re getting themselves into.
This is a common story in the stock market. Sabi nila high risk high reward e. Edi kinuha ko ‘yung biggest risk.Too many people bet all their savings on volatile stocks, only to lose all their money. Kahapon lang niya nakilala, in love na raw. What do we say to that? ‘Wag ganun, boss. Bad yun.
4. Don’t waste time.
You can always make more money later, but once time has passed then it’s gone forever. In trading and in life, focus on the most important things first. Grab opportunities while you can. Enjoy moments while you can. Spend time with people while you can. Because in both life and trading, you never know when you’re going to run out of time.
5. Help yourself before you help others.
This is a hard one, especially for us Filipinos who are always taught to be selfless and to put others first. But the fact is that you can’t really help others that much if you don’t help yourself first.
Master your craft. Become the best person you can be. Find what makes you happy. Keep yourself healthy. Live a balanced and fulfilling life. Then help others do the same.
6. Be sincere.
It sounds simple in theory, but it’s actually very hard to execute in real life—especially with so much noise from the media and society in general. It’s a harsh world we live in, and it can be tempting to just focus on your own survival. Sincerity is rare nowadays, but it doesn’t have to stay that way.
Remember that someone else’s gain does not need to be your loss. Be compassionate. Be kind. It can be something as small as saying a few heartfelt words to someone who’s having a hard time.
Be sincere in everything that you do and you will make your mark in people’s lives.
7. Know the rules, then break them.
Rules are important. They give order to our otherwise chaotic world. But not all rules make sense, some are outdated, and some are just plain stupid. A lot of rules are just the result of too many compromises and too many people saying, “Well that’s how other people do it” or “That’s what we’ve always done.”
Don’t be scared to challenge rules or the status quo, especially if you know it is for the better. You can still be respectful even if you speak up. And who knows? You might be the one to change the world someday.
8. Become comfortable with change.
Change is the only thing in life that is permanent. You won’t be able to anticipate everything that will happen, but you can learn to roll with the punches and turn unexpected challenges into even greater rewards. Take the hits that life throws at you. Learn from them, adapt, and improve.
9. Learn to welcome failure.
Even the most successful people in the world have failed—many times and at many things—sometimes even at the things they’ve become famous for today. Oprah Winfrey was fired from her first television job. Jack Ma applied to 30 jobs and was rejected 30 times. Walt Disney was once told by his boss that he had no imagination.
Failures are painful, but they are valuable. They teach us much more than success does, and they forge us into stronger, more resilient people. As odd as it may sound, some failures are very important.
10. Stop hiding behind your age.
Age is just a number. Young or old, don’t let age be the reason for you not following your dreams. Success doesn’t care when your birthday is as long as you work hard and commit. There’s no time like the present, and you don’t want to have regrets when you’ve used up your time in this world. Whatever it is that you’re passionate about. Do it now.
11. Become indifferent to money.
Don’t let money make you sad, but don’t let it make you happy either. Don’t let it control you. Money is just a tool, learn to become indifferent to it and you’ll be better off.
The real value lies in the ideas, the freedom, and the good that money can help bring to life. Focus on coming up with great ideas, giving yourself and your family the freedom to not worry, doing good for those around you. Do something worthwhile. Make an impact. Provide people with value and money will follow.
12. If you don’t want to be average stop acting average.
If you are not where you wanna be, then do something about it. It’s easy to just sit there and complain—and that’s why so many people do it! But that’s also why so many people never see the changes they want to see.
If you want something, stop spending so much time on TV shows and Facebook. Stop slacking and start getting to work. It’s going to be hard, but if you really want it bad enough then find a way to make it happen.
What about you? What are some of your tried and tested principles for success? Let us know in the comments below!
Support and resistance may be one of the most basic concepts in stock trading and technical analysis, but it is also one of the most useful. If you know how to use them well, you can already start building a profitable trading strategy. So here are 3 simple but powerful ways to use support and resistance in making profitable trades.
1. Find the best time to buy or sell your stocks.
This is a very basic use of support and resistance, but it is still one of the most effective.
The support and resistance levels often serve as an indicator of a coming shift or reversal of the current price movement. These levels serve as a guide for when we should start buying or selling a certain stock.
We buy stocks as the price nears the support level. Once it reaches the support, demand becomes stronger than supply and more people will want to buy that stock, making the price go up.
On the other hand, we sell stocks as the price gets closer to the resistance levels because this is when you can sell for the highest price. When the stock reaches the resistance level, more people will want to sell and the stock price will start going down again.
2. Identify stronger support and resistance by the length of time.
There are many support and resistance levels that can be found in a chart based on how long or short the time frame is. The longer the time frame, the stronger the support and resistance and the harder they are to break. In other words, a 10-year support or resistance is much stronger than a 1-month support or resistance.
Although the interpretation of a chart is subjective and different for everyone, seeing the bigger picture gives traders an idea of where the stock can go and how easy or difficult it will be for the stock to get there.
Next time you’re looking at support and resistance, try looking at the support and resistance across different time frames to see what the big picture really looks like.
3. Spot potential breakouts, which can lead to huge profits.
The resistance level, once broken, becomes the new support level. If sustained, it gives traders an idea that there is very strong demand for the stock. Breakouts like this usually signal the start of a major price trend, which can lead to huge profits.
This increased volatility during breakouts attract traders because it can offer great returns with a minimal amount of risk, especially if there is no existing resistance in place (i.e. when a stock breaks out to a new all time high).
Keep an eye out for breakouts and wait to see if they are sustained. If they are, it’s likely that you’ll be able to make a profit off of buying that stock.
Don’t forget, you can also combine these concepts to make your trading decisions.
For example, if you see that a stock has broken above its 10-year resistance, then you know from #2 and #3 above that it has the potential for huge profits and you should definitely consider buying that stock. If you want to buy a stock but it’s near its resistance level, then maybe wait a few days to get a better price.
Simple moves like this, applied consistently and with proper risk management will help you become a more profitable trader.
Do you have other tips and tricks for using support and resistance? Let us know in the comments below!