Categories
How to & Advice Latest Posts

What Type Of Trader Are You?

As there are different types of people that you will meet in your journey in life, the same principle applies at the beginning of your respective phase towards success in trading the markets. An aspiring market participant will ultimately submit themselves with a conscious choice of selecting what type of trader should they be.

These kinds of traders are separated into four categories, namely Day Traders, Momentum Traders, Swing Traders, and Position Traders. Each category is distinctive to that of its counterparties in terms of its timeframe and its style of approach towards a certain name.
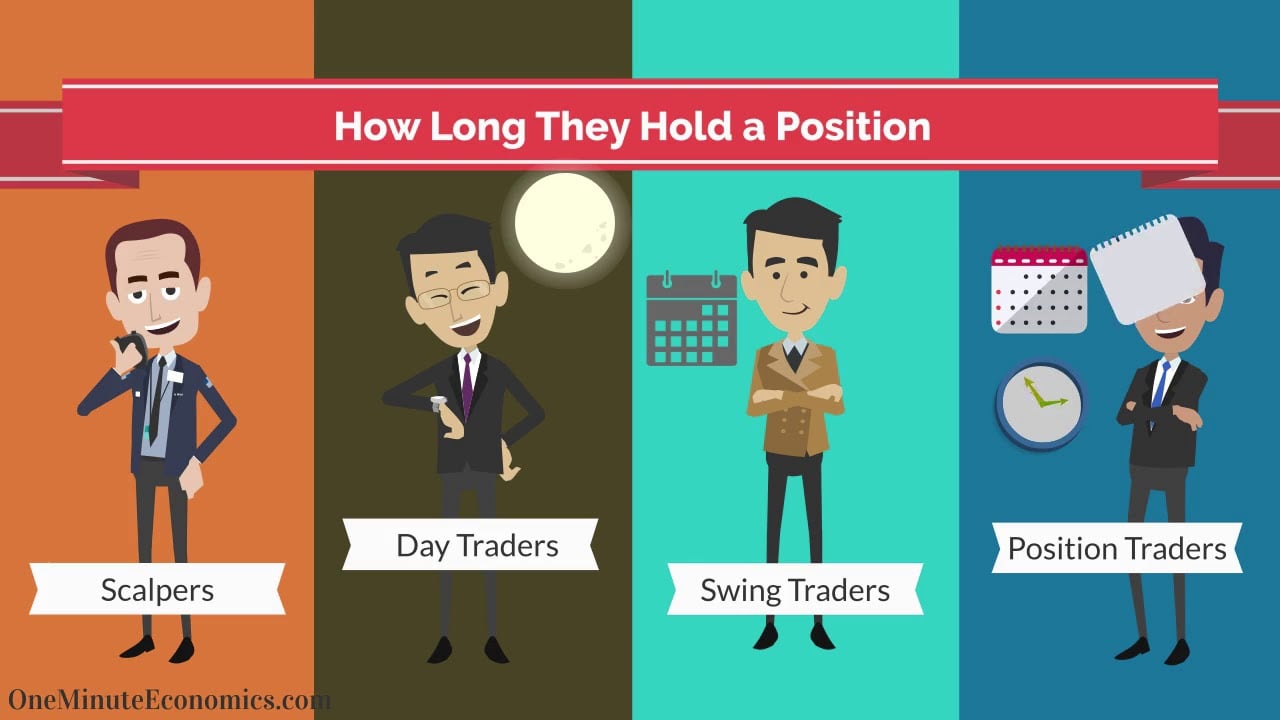
Source: OneMinuteEconomics.com

Day Traders

These are are market participants who get in and out of a stock or any asset class within a few minutes to a few hours. These types of traders do not hold any position overnight wherein they would sell all their existing positions before the market closes. Most day traders use leverage to further amplify their percentage gains and losses from incremental price movements. 

Momentum Traders

These people focus on bigger moves such as a breakout or a breakdown for long and short trades respectively. Ideally, these types of traders latch on to price movement that is supported with massive volume until the trend bends. The timeframe for such traders may last for a few hours to several days. 

Swing Traders

These traders are similar to Momentum Traders. This type also latches on to the prevailing trend until it bends. The timeframe for such traders typically lasts from a few days to numerous weeks. Both Momentum and Swing Traders focus on daily moves rather than intraday fluctuations, which is most applicable for traders who are also working a day job. 

Position Traders

Lastly, Position traders focus more on the bigger picture moves in a stock or any asset class. This type of trading is the exact opposite of Day Trading. Position Traders typically anticipate explosive moves that they deem to last in the longer term. Also, they are not concerned with daily fluctuations as they naturally hold their positions within a few weeks to numerous months. 

It is possible to mix these types depending on your personality and your goal towards the financial markets. For example, an individual could both be a mix of Swing and Position trading as they wish. To further aid an aspiring market participant on what type of trader do they belong, they may ask these questions amongst themselves.

What is my time horizon? Do I want to hold names in the short-term, medium-term, or long-term?

How much time could I spend in trading the markets? Do I have a day job? Can I trade the markets while I am working or only whenever I am free?

Do I want to see results quickly? Is it okay for me to execute trades every time or sometimes? 

Whichever type of trader that an individual may decide to be, it all comes down to their commitment to this craft. This endeavor requires patience, discipline, and hard work. An aspiring market participant should dedicate their deliberate practice or one’s 10,000+ hours to succeed in the markets. 


ARE YOU SERIOUS ABOUT YOUR TRADING? IT’S TIME TO LEVEL UP YOUR LEARNING AND EXECUTION.

JOIN THIS EXCLUSIVE COACHING + LEARNING SESSION WITH THE ONE AND ONLY, CHRISTIAN SILVERIO a.k.a. BEARYOTRADES.

Categories
Latest Posts News & Features

Featured Trader of the Week: Spidey

For this week, we would like to congratulate our featured trader: Spidey a.k.a. @spidey!

This trader was able to spot a stock affiliated by Nickel, one of the tradeable metals in the commodities market, called $NIKL or Nickel Asia Corporation. Spidey a.k.a. @spidey, is an active member of the Investagrams community who endlessly spreads his knowledge on the local market using Technical Analysis.

He mentioned the implications of the said candlestick pattern last October 8, 2020, wherein the displayed name exhibited a shooting star candlestick pattern, indicating a beginning of a downtrend. However, it is worth noting that a breakout of its pivot high invalidates the said downtrend bias for a said stock or any asset class. Moreover, given that Nickel prices heavily influence $NIKL, traders must check Nickel prices for more conviction in trading this stock. The same is true with names that are affiliated with any commodity or whatnot.

Technical wise, the stock broke out of the channel line that gave a 25% return (based on the October 12, 2020 top) in 4 days. The channel line was supported with a below-average volume, and the said breakout was supported with massive volume, which are critical features for any asset to continue its advance. It is a low-risk, high-reward trade, as the stop loss levels for the said breakout point around the 3-peso area could be below 2.95 (-4.5%), and the take profit areas could be the structural resistance at 3.8 (25%).

In the bigger picture, the said name is displaying an inverse head and shoulders pattern. It is ideal for the said stock to rise in confluence with the Nickel Futures to solidify its state for a significant reversal.

It is best for $NIKL to consolidate and hold above the 3.4-peso area with dried-up volume to form a constructive base. A break above the 3.8-peso area confluence with massive volume is superlative for this stock to continue its dominance.

As stated by Spidey a.k.a spidey, basing one’s bias through a single candlestick pattern may catch you off-guard. It is still ideal to be more focused on the cluster of candlesticks than a single candlestick. Then again, it depends on the end-user.

Congratulations to those who were able to maximize the technical swing of $NIKL. Lastly, kudos again to Spidey a.k.a spidey for sharing his trade analysis. Your FREE 1-Month InvestaPRO is on its way!


Categories
How to & Advice Latest Posts

Understanding the Balance Sheet

Turn that hassle into a hustle! Hirap ‘no?

It may seem really challenging and difficult, but it’s not only the job of the accountants or finance majors to check out and interpret the values in the financial statements. Difficult to absorb this? Well, yes. It will be difficult to take in. Number here, numbers there! But, understanding the balance sheet is both an art and science. It takes determination and a great skill in interpreting the numbers.

The balance sheet is one of the important financial statements that not only accountants must see, but even investors and traders. If you want to see the financial position of the company, check on the balance sheet! It reflects the growth of the assets and liabilities. At the same time, with the numbers on the balance sheet, you can see how the company handles the debt, “Malaya na ba sa utang?”. Now let’s understand the structure of the balance sheet. There are 3 main elements that makes up a balance sheet. We have the assets, liabilities, and owner’s equity. Now, let’s get to know more of each element. 

The Assets

Assets are known to be the resources of the company, which is divided into 2: the current and non-current. The difference between the current and non-current is the liquidity. Current assets are the resources that can be easily converted into cash, on a time period of 1 year. You must check on this portion to know if the company relies more on assets than liabilities. The examples of current assets are cash, accounts receivables, and prepayments.

On the other hand, non-current assets are the resources that would take more than a year to be converted into cash. These types of assets do not necessarily need a during of 12 months to have the resources cashed. Some examples are long term investment, PPE (Plant, Property, and Equipment) and other intangible assets. 

Checking the summary of the balance sheet or the graph of the assets can say a lot about the company’s growth on their resources. You may want to consider a company who can also easily liquidate its resources!

The Liabilities

Liabilities are obligations of a certain enterprise or a company. Just like the assets, liabilities are divided into a current and non-current liability. Current liabilities are expected to be settled within 12 months or 1 year. Examples of current liabilities include accounts payable, notes, loans, and interest payable. Meanwhile, non-current liabilities are expected to be settled after 1 year. Examples of this are mortgage, bonds, and long-term notes payable.

“Utang na naman!” Is this necessarily a bad thing? No! Liabilities can serve as another source of assets. However, if it turns out that you rely on too much liability, you can experience financial hardships! Remember, kahit si Aling Marites, mahihirapan kakasingil ng tatlong buwang utang mo!

The Equity

The equity illustrates the claimed resources of the business by the owner. These includes the capital investments, drawings, common stock, preferred stock, and the retained earnings. Take note that if the company has a negative equity, it illustrated that the quantity and value of its assets are not capable of covering the company’s liabilities, and this is a warning signal!

The balance sheet is more than just the assets, liabilities, and equity. This financial statement shows if the company is able to pay its obligations when times are rough, just like during this pandemic. With the help of the balance sheet, you can identify whether or not the company is a good investment through its value in assets, liabilities, and equity!

At the same time, mastering the skill in checking at the figures can help you know the company’s growth and sustainability. Continue to be wise and disciplined in studying your lessons and analysis! Sooner or later, you are able to choose your stocks wisely!


Click the photo to get your FREE ACCESS
Categories
How to & Advice Latest Posts

Eradicating The Superman Syndrome: How to achieve emotional stability in Trading

Have you ever experienced a losing streak which ultimately depleted your confidence in trading the markets? There is also a similar situation that is as dreadful. It is when you experience a winning streak that ultimately makes you overoptimistic. 

The Superman Syndrome enables you to feel like an eternal being thinking that the trader possesses a tremendous control over their next trades. The trader starts to execute setups that are not in conjunction with their trading system. As if the market participant deems that their future trades would be mostly right. The trader feels that they can bear with the extra losses as they have gained a significant hedge through their previous gains. The Superman Syndrome enables impulsive decision making through overtrading rather than being in Zen through being selective in their stock selection. 

It is also as bad as feeling lost and being diffident on your next trades. Thinking ahead that their next trades will be losers. An individual would find it difficult to execute a trade given the bias that is circling in their head. Being too defensive will hinder an individual from amassing the full potential embedded in the financial markets.

Having confidence in trading is a key aspect to achieve success in the financial markets. However, a market participant should not be reluctant nor conceited when it comes to their trading psychology. 

It is best to take a breather whenever you score huge gains and winning streaks to reset your urges. This also applies when your money is on the drain after a losing streak. As they say, trading is 80% psychology and 20% methodical.

Being in Zen while being free from external negative energies that could disrupt your trading is a non-negotiable aspect of this endeavor. Being in this type of state enables the trader to stay in the flow. Traders who are at peace tend to make themselves available on the endless streams of opportunity that the market is offering at any given moment.

Click on the photo to GET YOUR FREE ACCESS.

Possessing the urge to revenge trade or to trade impulsively due to the Superman Syndrome must be treated instantly. The same goes with being hesitant due to losing streaks. It pains to be in an emotional rollercoaster while pursuing this type of endeavor. As they say, you attract what you are.

To learn more about trading psychology, I highly suggest reading the book called “Trading in the Zone” by Mark Douglas. It is a trading psychology book that will enable you to master the market with the proper discipline, confidence, and attitude.

Categories
How to & Advice Latest Posts

Winning With Nothing But The Basics

Before entering the level 10 in a game, the player needs to start at level 1. Before even the famous Shakey’s or Mang Inasal have started, they have started small too! And just like any other investor or trader, everyone starts with the foundation of the basics in technical and fundamental analysis.

Winning in the stock market is a process. It is never just a one-step win or even a trade with 80,000 pesos gain. Everything starts with a good foundation of financial literacy, and this starts with the basics in technical and fundamental analysis.

Now, what’s in it for you to understand the basics? Understanding each concept of technical and fundamental analysis will help you assess the stock you are about to pick. It helps you gain more wisdom on how you should understand the stock market and the company on various perspective, just like how you would choose between wearing a casual or formal attire. Analysis provides information that will help you interpret the structure of the company or even understanding the figures on the financial statements.

As an investor, you must know the intrinsic and true value of a stock. You must be able to determine if the value reflects on the stock prices. Of course, who would like to buy a 500 pesos worth of ground coffee without knowing its history, background, and components! This is the reason that you should invest in knowledge on analyzing the stock market.

Fundamental Analysis

Fundamental analysis is not just defined to be any fundamental, basic, or elementary education. Understanding the component of fundamental analysis would help you asses the quality, profitability, sustainability, and growth of the company.

Start from a top-down approach, in which you would start analyzing information from general to specific. Now, how are you supposed to win the basics in fundamental analysis? Remember the acronym FLIGHT! And now we are boarding to our destination, the fundamental analysis

F stands for Financial as your Language

English and Tagalog are not enough in understanding the stock market. Make finance as your language.

Why? So that you can understand the financial characteristics and financial statements of the company you are about to invest into. Now, making finance as your language does not solely mean accounting or computing. It also helps you understand underlying factors and signals such the news and press releases of the company. Assess the valuation, earnings, and growth, of the company to know the financial health in terms of assets, obligation, ratios, and cash flows.

L stands for the Law of Demand and Supply

Math? Stock Market? And now Economics? Yes! You see, if there are sellers and buyers, there is a demand and supply in the market, and this makes the stock prices rise and fall. Take note that when the stock goes uptrend, there are many buyers. Otherwise, there are many sellers.

I stands for Intrinsic Value 

Always keep it in mind that you would want to buy a stock which reflects its value on the stock price. To know this, you must check the Price-Earnings ratio of the company and compare it among its peers or company of the same industry.

G stands for Growth and Good Investment

The relationship of the price and value also leads to quality of growth and goodness of the investments. In order to know the quality of the company, you must check on the high-quality rate of the company’s value on the financial statements (balance sheet, income statement, cash flow) and financial ratios (liquidity, operating, valuation, common size, solvency).

Never just check on one part of the structure! You must check the signals and be able to determine if the company is under too much debt or is it well operating on its finances.

H stands for Historical Performance

It is a must to check on the historical performance of the company to check whether or not they are growing. Ask yourself if it is the company you are willing to place your money into for a certain period.

T stands for Think not Trend

Never invest on a stock just because it goes trending or your friends tells you so. Think wisely and analyze the company’s stability and development. Remember being famous or big does not necessarily mean it is good investment.

And now we are unto our next destination, technical analysis. Now, let’s READ!

Technical Analysis

R stands for Reading Charts, Lines, and Patterns: Market Structure

Understanding the different charts, trend lines, and candlestick patterns will help you understand the market structure. With these visual representations, you can slowly begin to determine if the stocks are going uptrend, downtrend, reversal, or sideways.

E stands for Evaluation with Indicators

Now, in technical analysis there are various indicators. However, you must begin with learning the concepts then applying each and checking which one would fit your strategy as a scalper, day trader, position, or swing trader.

You must first understand the concept of floor price and the floor ceiling, also know as the support and resistance. Why? Because this will help you understand the breakouts and breakdown with the candlesticks,

You can also use the RSI, to know if the stocks is overbought or oversold, or the moving average to know the buy signal. There are various purposes of indicators. But most importantly, this will help you enter and exit the market on a great time.

A stands for Assessing yourself 

Assessing chart movements is useless if you do not have risk management and control over your emotions. As Alexander Elder quoted, “the markets are unforgiving, and emotional trading always results in losses”, and I guess you wouldn’t want that either!

D stands for Don’t forget to read and do a strategic application

After all these points to remember, always enjoy learning and re-learning over and over again.

Charlie Munger: The game of life is the game of everlasting learning. At least it is if you want to win.


CLICK ON THE PHOTO TO GET YOUR INVESTAPRIME ELITE FREE 14-DAY ACCESS!
Categories
Latest Posts News & Features

Featured Trader of the Week: Potato a.k.a @lazypotato

For this week, we would like to congratulate our featured trader: Potato a.k.a. @lazypotato!

This trader was able to spot one of the market leaders of the local market – $CHP or CEMEX Holdings Philippines Inc. Potato a.k.a. @lazypotato is a new and active member of the Investagrams community, yet already ceaseless in providing his analysis and insights focusing on the local market.

Along with his analysis of his stock selections, he also highlighted that a trader must take things with a grain of salt. When it comes to grasping ideas of other market participants, he said that a trader must be careful in following or absorbing their ideas. We will never know if other’s analysis were made purely because of goodwill or because of hyping/bashing. Thus, it is always important to trade at your own risk (TAYOR) and with caveat.

As the said stock rose from its initial base, the stock consolidated for more than a month. The consolidation phase was also supported by below-average volume. Moreover, he also shared that the recent breakout of the said stock was in confluence with heavy volume, RSI (14) breakout of its trendline channel, MACD bullish crossover, and alignment of the stars (AOTS) in the form of moving averages.

Having multiple indicators confirm a buying signal indicates better chances that the move will continue its ascendancy. However, let us not forget that anything can happen in the markets. As traders, we should respect our stops if any unforeseen event occurs.

Moreover, there was a bullish divergence in the RSI (14) in its initial base prior to its rise. If you missed out on this trade during its rise last August 5, 2020, an opportunity reemerged when the stock was able to hover above the previous resistance which turned to the new support at the 1.4-peso levels.

The ideal buy point was the 1.4 (support) or the 1.5 (trendline breakout) peso levels. It is a low-risk, high-reward trade, as the stop loss levels for the said breakout point could be below 1.42 (-5.5%) if you bought it on its trendline channel pattern. On the other hand, the stop-loss levels for the said structural support levels could be below 1.34 (-4.4%). Take profit areas could be the structural resistance at 1.9-2-peso area (30%-40%).

In the bigger picture, the monthly chart also exhibits a bullish divergence along with a triangle breakout. $CHP must sustain and consolidate above the 2-peso levels to further assert its dominance.

Market participants should not feel lonely when they miss a trade. Given that the financial markets offer a multitude of names from various asset classes that are operating in different timeframes, the markets are bound to give an endless stream of trading opportunities to those individuals who make themselves available for whatever the market is offering at any given moment.

Congratulations to those who were able to maximize the reversal play of $CHP. Lastly, kudos again to Potato a.k.a. @lazypotato for sharing his trade analysis. Your FREE 1-Month InvestaPRO Access is on its way!


Are you up to the Challenge of Investa Cup 2020? Registration is STILL OPEN UNTIL OCTOBER 4.

Hurry! Join now!

Click on the photo to join.


Categories
How to & Advice Latest Posts

Should You Become an Independent Operator?

Being an Independent Operator is a skill that seems difficult to do for most aspiring traders. The ability to cancel the noise regarding various opinions from fellow market participants is essential to being profitable in the years to come. Craving for the insights of other traders towards your trade selection is not an ideal way of amassing consistency in the long run.

The late Jesse Livermore, one of the best traders in the world, also succumbed to the opinions of others back in the day. This shortly led him to financial ruin. As he exclaims, the markets are never wrong, only opinions are. Furthermore, the late Nicolas Darvas also experienced something similar.

After developing the Darvas Box system, there was a phase in his life where he moved next to the office of one of his brokers. This led him to jive in with rumors, opinions, and insights with regards to his stock selection. After both critically acclaimed traders experienced turmoil, they started to commit to the golden rule of deciding their stock selections by themselves.

Source: QuotesonFinance.com

Even if these events happened sixty to eighty years ago, it is still relevant up to this day. These events still happen in the trading community today. People pushing their thoughts in social media, people debating about their stock picks, people telling the community to ride in the stock as it reaches the moon. Unfortunately, this is inevitable.

The financial markets will never change so long as human nature never changes. Given that it is predominantly humans who trade the markets, the behavior of which will always be in accordance with human nature.

Source: Steve Burns’ Twitter Post

If you crave and rely on another person’s bias towards a stock or any asset class, how can you become an independent operator? It is a fact that everyone is unique. We have different perceptions regarding a subject matter.

Avoid being succumbed to rumors and opinions about the markets. I am not saying that we should not seek individuals who are better than us to guide us in our journey, what I am trying to say is that you have to learn how to take things with a grain of salt. Seek knowledge and insights on HOW TO DO IT ON YOUR OWN. Just as in life, you cannot long for your parents’ guidance forever.


You still have the chance to be the Champion of the Biggest Trading Competition in the Philippines! Trading Cup 2020’s Registration is open until OCTOBER 4. Join now!

Click on the photo to join.

Subscribe to our Newsletter

Join our mailing list for investing tips and stock market advice
to help you reach your first million.

You have Successfully Subscribed!