Categories
Latest Posts

Featured Trader of the Week: @soservin07

All the way from Canada, let’s give a round of applause and congratulate our featured trader of the week @soservin07!

One of the key techniques in trading is learning to create a state of mind that is not affected by the market’s behavior as said by Mark Douglas. As an experienced trader in the market, @soservin07 reminds us to trade smartly and to do our own research before clicking the buy/sell button.

Just recently has @soservin07 given his in-depth thoughts about the market which has allowed us to obtain valuable information when trading.

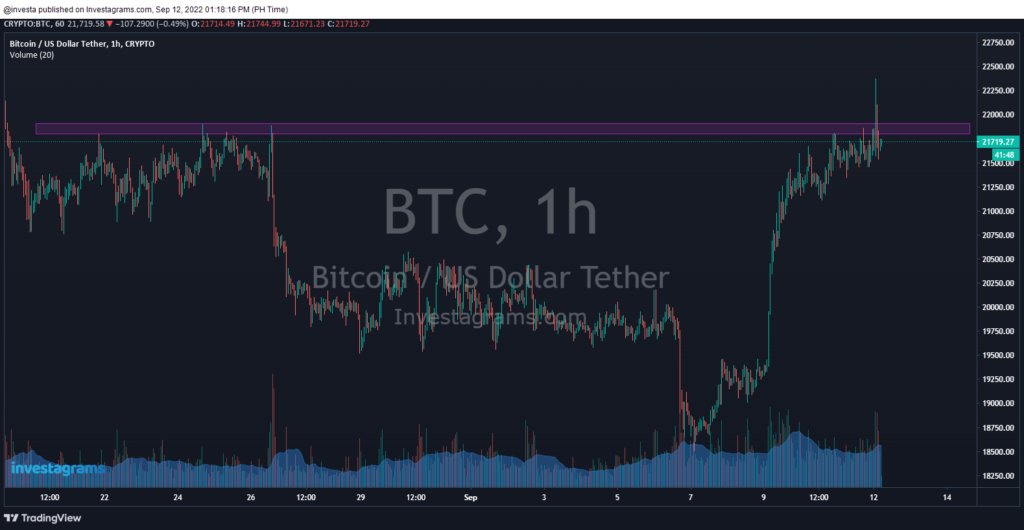
About two weeks ago, our featured trader showed us his thoughts on $BTC, the top crypto coin in the market. With so much FUD going on on the market, many are still unsure on where this coin will go in the next couple of days. 

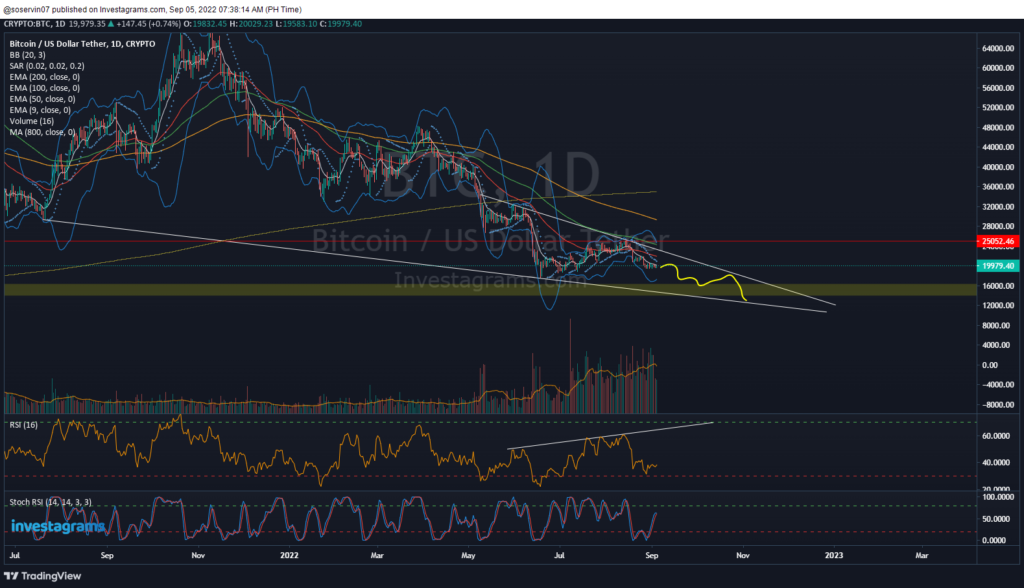
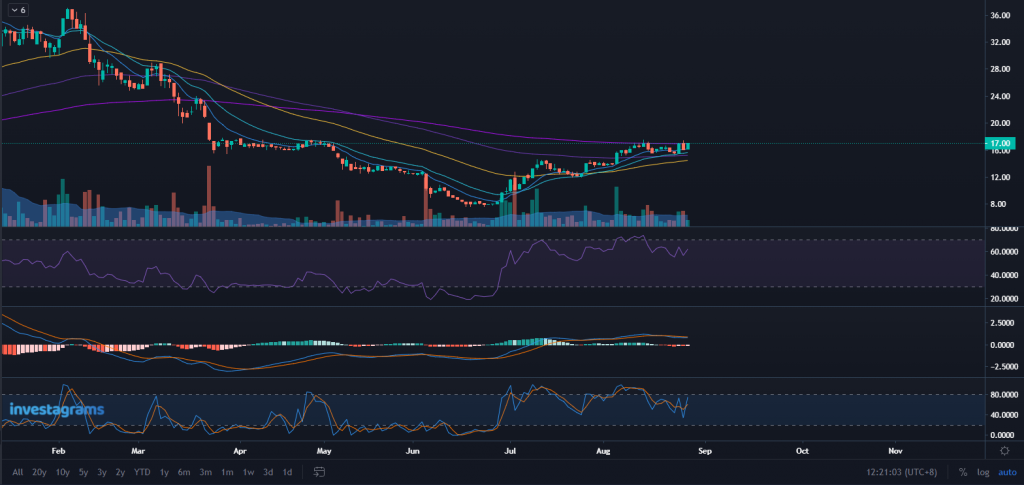
During this specific trading period, @soservin07 has plotted multiple technical indicators which would help him predict price actions for his trading plan. As we can see, he has included bollinger bands, parabolic SAR, multiple EMA’s, RSI and Stochastic RSI. He hopes that we would see signs for the next bullish cycle if it breaks 25k, but if it doesn’t, a 15k down to 14k would likely be the worst case scenario. As of today, $BTC is ranging around the 19k-20k levels. 

TECHNICALS OF THE TRADE

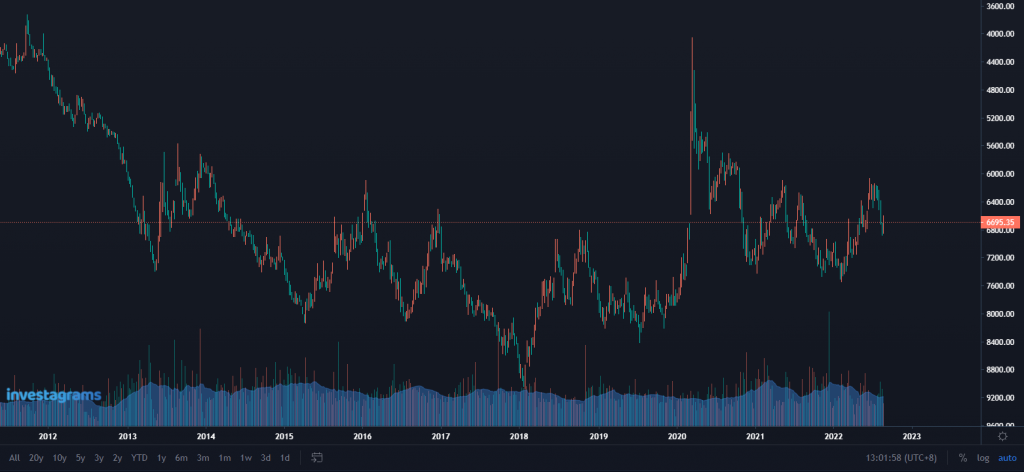
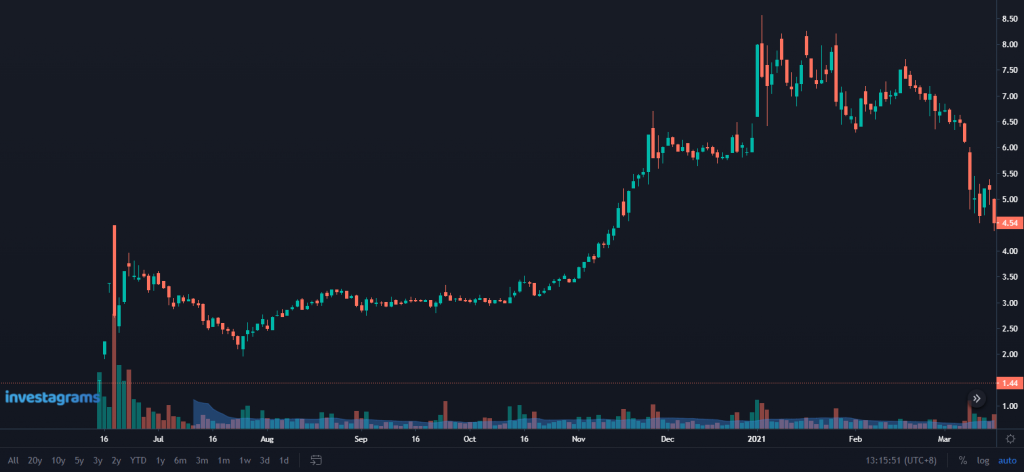
In terms of technicality, $BTC has hit a 52-Week Low of 17,614 indicating a strong support level around that area and a 52-Week High of 68,906.48. As we can see in his chart, he has plotted a “Tight Descending Wedge” indicating that a bullish cycle would be possible in the days to come. We may also notice in his chart that the price of $BTC is below most MA indicators he has plotted, indicating that prices are below average compared to the days before. RSI during that day was around 40-50 levels meaning it was neither overbought or oversold during that specific time period. However, as we look at its stochastic RSI, we may notice signs of reversal as a cross is seen to take in play. Volume levels are also seen to be slowly increasing compared to the previous weeks.

FUNDAMENTALS OF THE TRADE

Just recently, the CPI report has been released with inflation slowed to 8.3% in August. This has plunged almost, if not, every market in the world with BTC dropping almost 10% after the inflation report. With the global economy still on the verge of collapsing due to high interest rates and prices, trading BTC at the moment would not be the best option for most traders as FUD would cause them to pull their investments out. As of today, BTC has a total market cap of around 387 billion.

WHAT SHOULD BE MY NEXT MOVE

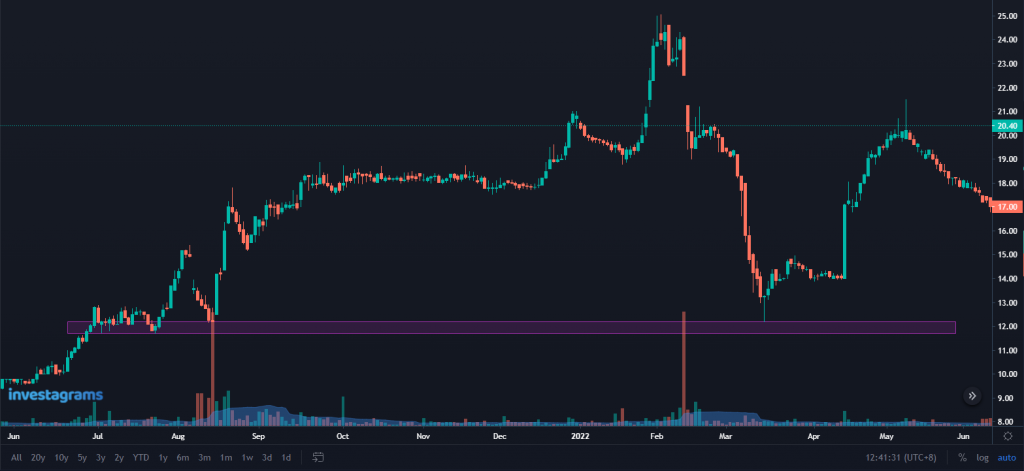
In the daily time frame, BTC is forming a descending triangle, which is often a bearish pattern. It is currently trading above $20k while maintaining the $19.8k support level. From here, we can anticipate a short-term bounce up to the $21.5k–$22k level, after which another rejection is possible.

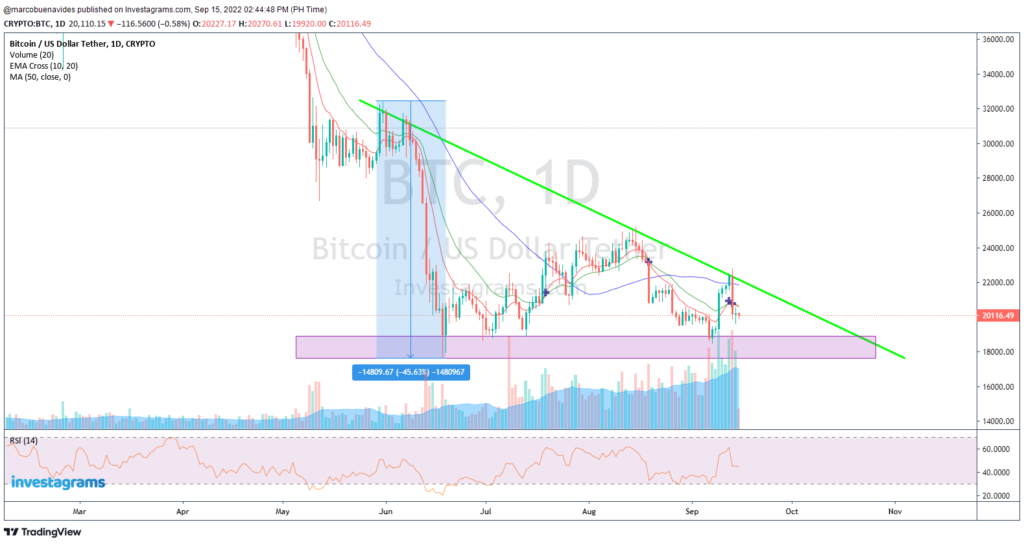
Any daily closing below the $18k level will confirm the breakup of this descending triangle, which is a critical support level for BTC. After the breakdown, we may see levels between $12k and $13k.

Take note as well of the recent EMA Cross (10,20) which signals a bearish reversal for BTC. Prices are also seen to be below average in the last 20 days with its RSI around 40-50 indicating that it is neither oversold or overbought. 

With all the FUD on the market and the current global economic status, dollar cost averaging would most likely be your best option. Buying the dips with small percentages of your total capital would be a great strategy to slowly build up your portfolio, while at the same time, taking advantage of the economic status of the world.

When trading, always buy the fear and sell when everybody else is happy. As what @soservin07 said, always do your own research and trade smartly. Once again, KUDOS to @soservin07 for being this week’s featured trader! Enjoy your 14-day InvestaPrime Access and continue to be an inspiration to the trading community.


Categories
How to & Advice Latest Posts

What are Bull Traps and how to Avoid Them

For any trader with experience, bull traps are the worst. One minute, a stock could be rallying after a breakout. Then stops are suddenly hit only a couple of hours later as prices plunge downwards. Bull traps happen pretty frequently. It’s a part of the reality that traders have to face.

For traders who haven’t encountered this annoying market behavior yet, it would surely pay to learn more about it. Let’s dive into what exactly bull traps are and the countermeasures we can take!

Bull Traps

A bull trap is often known as a “false signal” in the market. As the name suggests, they often trap buyers – forcing them to close their positions as their cut loss points are hit. Bull traps can take many forms. Bull traps commonly appear as false breakouts. However, they can also come in the form of reversals that fail. Generally, you can identify bull traps when you see bullish technical patterns that appear to be working, only to fail in the following candlesticks. 

SPX counter-trend rally bull trap

A recent bull trap that occurred was in one of the U.S. stock market indices, the S&P 500. The gist of this was that everyone thought the inflation-interest rates fiasco was over. Players in the market assumed the Fed already turned dovish. As enthusiasm filled wall street, stock prices rallied. The general 4,200 level was the major resistance to break. Although prices broke past, the breakout immediately failed in the following week. As prices failed to hold, this only proved that the breakout was but a mere bull trap.

Bitcoin intra-day bull-trap

Just recently, Bitcoin also staged a rally. While the trend is still intact, prices created a bull trap scenario for intra-day traders. 21,800 was proving to be a resistance point that needs to be broken. Prices suddenly surged past the level, only to fall back quickly in a matter of hours. Again, the move trapped breakout buyers.

ACEX ongoing retest

This one is still an ongoing case. Will $ACEX hold above its resistance-turned support, or will it become a bull trap? Again, prices broke out of a major resistance level (17.00). Currently, prices are still retesting the level. If 17.00 fails to hold, the move can then be labeled as a bull trap. However, as the level still holds we can’t determine yet if the move was only a sucker play, or if it still has short-term potential.

The market psychology behind bull traps

As always, we need to understand the market dynamics behind certain behaviors. For shortable markets, these moves happen when bears start to take control. Since breakout strategies are already common, advanced market participants take advantage of creating false breakouts in order to get better prices for shorting. They are also able to short a bigger amount as breakout buyers put more liquidity into the market. 

For long-only markets, bull traps often take place during bearish environments. There will always be outliers in every market. However, not all breakouts tend to stay strong. Traders who are aware of this often make the adjustment of selling early into the breakout. While most retailers are still buying in hopes of a jackpot, seasoned veterans are already selling. In effect, this creates bull traps.

How do you avoid bull traps?

This begs the question, how do you avoid bull traps? Like all other losses, it’s impossible to fully avoid all bull traps. Breakout strategies are still strong tactics that can be used in trading the markets. Although not all can be avoided, you can take extra precautions or certain adjustments to avoid getting caught all the time

Look at the macro view of the market

As mentioned, bull traps often happen when the overall environment is bearish or when bears are in control. Hence, it would make sense to look at the bird’s eye view of the market. For example, if the index of the market you are trading is bearish, you can expect bull traps to happen more frequently. From there you can start to look at how you can make adjustments.

Selling quickly into strength

If you already know that the broad market has turned bearish, adjustments need to be made. There is a wide variety of tactics that can be employed. Selling into strength is one of the simplest, yet effective ways to avoid bull traps. Rather than trying to follow an uptrend, you can opt to sell profits quickly after a breakout. This entails lower risk-to-reward ratios, so you have to tweak your strategy to suit your style of trading better.

Buying tranches at support

As rallies are more short-lived in bearish environments, shifting tranches bought closer to support levels can be a viable adjustment. This will also let you get better risk-to-reward ratios if you choose to sell into strength after breakouts. However, keep in mind that you are also exposing yourself to the risk of breakdowns. 

Finding the right strategy

There are limitless variations in how you can adjust the way you trade. What was mentioned above are only just examples of adjustments you can make. As different market conditions demand different needs, you need to be flexible. This is where experience and preparation come in. Through being consistent with doing the hard work, such as studying your trading journals and reflecting on charts, the better you will be at anticipating possibilities and adjusting your strategies in your own unique way.


Categories
Featured How to & Advice Latest Posts

Featured Trader of the Week: @jrebong

Our featured trader of the day is basing his trades on price and and trend analysis! Let’s give a round of applause and congratulate our featured trader of the week @jrebong!

Ray Dalio once said that “In trading, you have to be defensive and aggressive at the same time. If you are not aggressive, you are not going to make money, and if you are not defensive, you are not going to keep the money.” In the case of @jrebong, he believes that an entry of trade using TA is a must as it helps him to be more successful in terms of trading accuracy.

@jrebong has been a member of the Investagrams community since March 2016 and has been very active and sharing his trades. 

A couple of weeks ago, our featured trader posted his technical analysis on $ABA. A hot stock in the local market and a key player in the mining industry locally. $ABA recently surge with a whopping positive close at 2.36 with 7.76%.

As the stock recently reached a 52-wk high at 2.36. @jrebong charted its support, volume, and resistance,  on the chart, bound for a breakout in its trendline as he believes in its technical analysis. @alphatraderph felt an opportunity to have a good entry near the support and HOLD for a while.

TECHNICALS OF THE TRADE

In sequence 1, our featured trader charted RSI, MA, EMA, Volume and Stoch. Furthermore, as $ABA recently reached 52-wk high at 2.36 area. It is further to move up more and retest at 2.5 and 2.6 onwards before it pullback or retest in the 2.2-ish area. It’s RSI is overbough already but this will matter whether it will surge or pull back in the next few weeks. It’s MA remained uncrossed as it surges. ABA’s chart looks good in the market as local and foreigners are jumping in with the stock. The support of this stock is at 2.2 and 2 area. It’s resistance remained unknown since ABA closed at 52-wk high. While other mining stocks are falling, ABA remained strong and break its previous resistance and closed at 52-wk high. On the next sequence of the photo, our featured trader urges local and foreigners to ride in as it breaks out. He assumes that it will further surge and might be profitable for trading. Furthermore, it is best to observe technical indicators as ABA remained a hot topic recently. 

@jrebong was confident that this stock will further surge as he indicated in sequence 1 photo that this stock might be explosive. Explosive meaning that the stock will surge and will further break resistances. He did not charted support and resistances. However, he remained positive for this stock as he is obviously aware that it is overbought already and might be retesting in the next few weeks. Further to that, he is encouraging fellow traders to ride-in as he believes that ABA will further surge more.

FUNDAMENTAL CATALYST

AbaCore Capital Holdings, Inc. is a holding company whose shares are listed and traded in the Philippine Stock Exchange (trading symbol: ABA). At present, AbaCore Capital Holdings, Inc. has interests in the leasing of gaming equipment, gold and coal mining, real estate and financial services.  

As of September 02, 2022, the ABA closed at 2.36, 52-wk high. ABA remained underrated for some as book value per share of ABA is at 3.5 2Q 2022. Further to that, ABA is engaged with the businesses above. Furthermore, its key indicators are the following: return on assets, return on equity, earnings per share, current ratio, debt-to-equity ratio.

Return on assets: 0.09%
Return on equity: 0.10%

EPS: 0.0025%
Current ratio: 2.817:1
Debt to equity ratio: -1.39:1

The ability to pay for a company to its debts plays a vital role for each company. Based on the financial indicator of ABA, this will depend on you whether you will invest or not. Furthermore, ABA remained speculative for some and an ideal for some. Based on its financial statement and key indicators, it is some how doubtful for investors to ride in with ABA as its financial statement is doubtful for some. It is best to observe what will ABA will do in the next few weeks (For its TA and FA)

WHAT SHOULD BE MY NEXT MOVE

As the stock recently 52-wk high, it would be wiser to observe and wait for what $ABA might do next before jumping in. This stock is speculative since the industry right now is a much more focused industry by the national government. In terms of trading, the demand from consumers is continually growing. However, it’s best to wait for a consolidation, pullback, or a good entry near its support for a better risk-to-reward ratio. It would also be advisable to trade lightly and in tranches given that we’re not yet out of the woods.

Once again, KUDOS to @jrebong for being this week’s featured trader! Enjoy your 14-day InvestaPrime Access and continue to be an inspiration to the trading community.


Invest to build a better future and learn continuously to improve yourself.

Join our #InvestorDay 9.9 and get a chance to win LIFETIME ACCESS to our InvestaFest premium recorded videos and have the opportunity to learn straight from top traders, entrepreneurs, industry leaders in the country!

To join, simply:
1. Download Investa app
2. Complete application
3. Invest for as low as Php 1,000.00 to claim your 150 raffle tickets

You can invest as much as you want on or before September 9 and claim unlimited raffle tickets!

Invest today: http://invs.st/IVGWInvestorDay99Daily

Categories
Featured How to & Advice Latest Posts

What to Know About Mutual Funds

Almost everyone knows by now that investing is a great way to grow your wealth. However, the biggest barrier for most people is often not knowing how to invest their funds. Luckily, there are Mutual Funds. Mutual Funds are a great way for people with no experience to start investing. Among the different assets, it is the easiest one to invest in. Let’s dive into what they are and what you need to learn first before you get started.

Mutual Funds

Mutual funds are issued by investment companies regulated by the Securities and Exchange Commission (SEC). There are different kinds of Mutual Funds. There are some that invest solely in stocks, while others focus more on fixed-income assets. They can also be categorized based on if they invest in the local or global markets. In fact, some go as far as to state whether they invest only in specific industries, or if they invest in the broad market. The easiest way to figure out the details of a specific fund is to read their Fund Methodology. From there, you can figure out if you’re interested to the fund or if you’d prefer something else.

NAVPS

Aside from a fund’s methodology, you also have to keep track of the funds value. The NAVPS, or Net Asset Value Per Share, refers to a Mutual Fund’s market price. When you invest in Mutual Funds, you will be buying shares of the fund. The NAVPS serves a function similar to a stock’s price. With this you can determine how the fund has been performing, and you can keep track of how your investment has faired moving forward.

Where do you find the NAVPS?

Usually, NAVPS is often reported at the end of the day by your broker or platform.

For example, in the InvestaPH platform, you can look for your fund of choice to figure out its NAV.

Why are Mutual Funds a good investment?

Mutual Funds have a low barrier for entry as it only requires a small amount to start. In addition, incremental top-ups also only require a small minimum a mount. For example, investing in a diversified Mutual Fund allows you to stay invested in a bigger group of companies while enjoying tax-free profits. On the other hand, individually investing in these companies by yourself would cost you more commissions and taxes, along with a bigger investment minimum.

Mutual Funds also save you the effort of having to research on your own. Since a professional fund manager takes care of this, you don’t have to worry about making decisions and executions. All you need to do is find the fund that fits you, then invest in it.

Are mutual funds safe?

Like all other investments, mutual funds are subject to losses as well. However, the goal of a mutual fund is to build or protect wealth in the long-term. Losses are unavoidable in the short-term, but most of the time you can bank on the experience and knowledge of the investment companies to make the right decisions and do what’s best for your investment.


Invest to build a better future and learn continuously to improve yourself.

Join our #InvestorDay 9.9 and get a chance to win LIFETIME ACCESS to our InvestaFest premium recorded videos and have the opportunity to learn straight from top traders, entrepreneurs, industry leaders in the country!

To join, simply:
1. Download Investa app
2. Complete application
3. Invest for as low as Php 1,000.00 to claim your 150 raffle tickets

You can invest as much as you want on or before September 9 and claim unlimited raffle tickets!

Invest today: http://invs.st/IVGWInvestorDay99Daily

Categories
Latest Posts

Featured Trader of the Week: @alphatraderph

An alpha way for charting technical analysis! Let’s give a round of applause and congratulate our featured trader of the week @alphatraderph!

Alexander Elder once said that “The goal of a successful trader is to make the best trades. Money is secondary.” In the case of @alphatraderph, he believes that an entry of trade using TA is a very must as it helps him to be more successful in terms of trading accuracy.

@alphatraderph has been a member of the Investagrams community since Aug 2018 and has been very active and sharing his trades recently. 

A couple of weeks ago, our featured trader posted his technical analysis on $VUL. A hot stock in the local market and a key player in the mining industry locally. $VUL recently broke its resistance at the 0.89-ish area.

(Sequence 1)

As the stock recently reached a 52-wk low at 0.76-ish area. @alphatraderph charted its support, volume, and resistance,  on the chart, bound for a breakout in its trendline as he believes in its technical analysis. @alphatraderph felt an opportunity to have a good entry near the support and HOLD for a while.

TECHNICALS OF THE TRADE

In sequence 1, our featured trader charted a cup and handle for a further breakout. Furthermore, $VUL broke its trendline at the 0.89 level and as of August 26, 2022, closed at 0.96. Thus, the stock recently reached the 0.98 area and is bound for a retest in the 0.89-0.92ish area. After breaking out at the 0.89 level, VUL’s volume surges along with MA. On the other hand, others are falling and consolidating. VUL is showing strength in terms of volume as it continues to retest after breaking out the resistance area. It came from a 52-wk low of 0.76ish before surging and breaking the 0.89ish and 0.93ish area, respectively. There could be a retest in the next few weeks for this stock to retest in the next resistance area at 1 PHP per share and above. Technically speaking next resistance of RRHI  is the 1 level onwards. Furthermore, VUL will retest whether it will break out at a 1 area or be back at the bearish side at 0.89-ish, 0.76-ish, and below area.

(Sequence 2)

@alphatraderph was confident that this stock would further go up as he charted a cup and handle indicator in which it is bound for a breakout or surge in the stock. He also charted that VUL will go up and will retest as he indicated support and resistance in the sequential posts he made. He charted a good entry near the 0.81 area. He is also observing the movement of VUL. Further to that, he is planning his trades carefully and aligning them with TA. 

FUNDAMENTAL CATALYST

VULCAN INDUSTRIAL AND MINING CORPORATION is a company that finds, develops, and produces oil and gas reserves and other mineral properties. The Company is also a participant in several service contracts, mineral production sharing agreements, and geophysical survey and exploration contracts entered with the Philippine Government, through the Department of Energy.

As of August 26, 2022, the VUL closed at 0.96. VUL remained speculative as it has a negative return on assets amounting to -476.97%. However, $VUL has been a trend recently, and the volume from the locals and foreigners is increasing. It is still unknown whether $VUL will rise further or fall back. However, the Philippine Government has recently been focusing on the new regime of fiscal policy for the mining sector. This will further be speculative depending on the fiscal policy that will be passed as law. Thus, it is best to observe $VUL and plan a good entry and exit as VUL and other mining stock companies will further be speculative. In addition, the Philippine Economy is expected to rely on the mining sector to further collect funds from this industry.

(SEC17Q 1Q2022, VulcanMining)

(Sequence 3)

WHAT SHOULD BE MY NEXT MOVE

As the stock recently breakout from 0.89, it would be wiser to observe and wait for what $VUL might do next before jumping in. This stock is speculative since the industry right now is a much more focused industry by the national government. In terms of trading, the demand from consumers is continually growing. However, it’s best to wait for a consolidation, pullback, or a good entry near its support for a better risk-to-reward ratio. It would also be advisable to trade lightly and in tranches given that we’re not yet out of the woods.

Once again, KUDOS to @alphatraderph for being this week’s featured trader! Enjoy your 14-day InvestaPrime Access and continue to be an inspiration to the trading community.


Invest to build a better future and learn continuously to improve yourself.

Join our #InvestorDay 9.9 and get a chance to win LIFETIME ACCESS to our InvestaFest premium recorded videos and have the opportunity to learn straight from top traders, entrepreneurs, industry leaders in the country!

To join, simply:
1. Download Investa app
2. Complete application
3. Invest for as low as Php 1,000.00 to claim your 150 raffle tickets

You can invest as much as you want on or before September 9 and claim unlimited raffle tickets!

Invest today: http://invs.st/IVGWInvestorDay99Daily

Categories
Latest Posts

How to Avoid Common Technical Analysis Mistakes

Similar to how doctors have X-rays and MRIs, tools are also needed to navigate the markets. Among the different methods traders and investors can use, technical analysis is the technique not known to many of the masses. Despite this, it has still proven to be a powerful tool as many of the great traders across history have used it in their own unique ways.

What is technical analysis?

For those unaware, technical analysis is basically the study of price and volume in order to understand where prices might go in the future. Through the use of charts and indicators, traders and investors can assess what they need to do.

The beauty with technical analysis is that it lets traders creatively pinpoint how demand and supply will play out in the market. It might look intimidating at first, but reading and plotting charts out isn’t rocket science. You just need to learn the foundations and know how to apply them as your trading system progresses. However, as with all techniques there are some common mistakes that are often made. Here are some of them and how you can avoid them to really make the most out of your trades.

Common Technical Analysis mistakes

Using too many indicators

When people first employ Technical Analysis in their trading, most think of the same image: a chart full of lines and indicators. Often taken from media, people often have the idea that using charts require the use of complex drawings and the like. However, this is very far from the truth of what effective Technical Analysis looks like. When using Technical Analysis, you have to remember that indicators are only tools. In the end, you are the one that tries to identify what the market’s current situation is. Indicators only serve as helpers in helping you figure it out. 

For example, using a chart like the one shown might make you look cool to non-traders, but will it really help you? Professional traders often have two or three different indicators, but you need to realize that each one serves a purpose. Adding indicators should serve the purpose of making it easier for you to gain crucial information. If an indicator you added does little to help you analyze the market’s condition, then maybe its time to take it out. Remember: price is king and volume is queen. Indicators only exist to serve these two.. 

Not understanding the foundations of Technical Analysis

Somewhat related to the overuse of indicators, traders often fail to understand the foundations of Technical Analysis. Although the basic tennants are easy to learn, only a few master the concepts. It’s not uncommon for the basics to be rushed in order to go towards more exciting and advanced theories. While learning advanced concepts can be helpful, the basics will always serve as the foundation for progress. For example, if in the act of learning complex patterns you start to become unaware of supports and resistances, start thinking twice on how you should proceed. 

How basic a chart looks like doesn’t determine the potency to make a profit. In the end, its a better understanding of price action that allows traders to use charts to the fullest.

Lack of flexibility

Understanding patterns of behavior within the market is the core of technical analysis. In a sense, we go through the history of the markets in order to understand how it might move in the future. However, as Mark Twain famously said: “history doesn’t repeat itself, but it rhymes.” A common pitfall in using technical analysis is that traders think the market will react in the exact same way as before. Although the markets behave the same way even as time passes, patterns won’t exactly replicate one another. Flexibility is needed in order to adjust to the small changes that occur in how prices move. People often rely too much on the possibility of a pattern happening again in the exact same way. So much so that opportunities are lost, or trades fail.

In the example above, if a trader were to rely too much on the pattern that retracements occurred at the 100-day exponential moving average, then he or she would’ve missed the chance to make a profit on the latter rally. 

Biases

The problem with biases is straightforward. One example is when a trader starts to favor a stock above the rest, every signal starts to become bullish. There are many kinds of biases than the one mentioned above. Each one just as dangerous as the other. Having biases takes away a traders ability to objectively analyze the market. 

Take a look at the picture above. Are you bullish or bearish? Once you’ve made your choice, read the next line.

The chart shown above is the $PSEi weekly chart inverted upside down. Disregarding the color of the bars and looking only at how the chart has formed, can you still give the same answer before you found out? Different biases will incur different problems for traders. However, the generalized solution to solve biases is to become as objective as possible in your decision making process.

Ignoring macro conditions

Lastly, a fatal flaw that many encounter is failing to recognize macro conditions. Discounting macro events, many traders, especially beginners, fail to even chart indices as part of their planning process. Looking at the price action of individual stocks and other assets is important. However, you need to realize that how the broader market moves will impact the behavior of whatever your trading. Often times, extreme moves in the stock market index or other benchmarks will cause the strongest price action patterns to fail and even reverse the trend. 

At the very least, make sure that you’re always aware of how market benchmarks/indices are moving. They will help you determine if its time brace your portfolio for an upcoming sell-off. Of course, they will also let you know when its time to start aggressively buying your top picks. 

The journey ahead

In your trading journey, you will encounter many unique styles of trading. Each one often different in some way to another. Even if two traders use technical analysis and use the same indicators or patterns, nuances will still be spotted. The most important thing you need to remember is that you need to find a style of trading suitable for you. You need to establish your own understanding of the market that will help you create a process in making trading decisions. When you find one, make sure that you master it first rather than seeking other ways to trade. As the saying goes, “I fear not the man who has practiced 10,000 kicks one, but I fear the man who has practiced one kick 10,000 times.”


Invest to build a better future and learn continuously to improve yourself.

Join our #InvestorDay 9.9 and get a chance to win LIFETIME ACCESS to our InvestaFest premium recorded videos and have the opportunity to learn straight from top traders, entrepreneurs, industry leaders in the country!

To join, simply:
1. Download Investa app
2. Complete application
3. Invest for as low as Php 1,000.00 to claim your 150 raffle tickets

You can invest as much as you want on or before September 9 and claim unlimited raffle tickets!

Invest today: http://invs.st/IVGWInvestorDay99Daily

Categories
Latest Posts

Featured Trader of the Week: @marketpainterph

Congratulations to @marketpainterph for being the featured trader of the week! 

@marketpainterph has been sharing his thoughts consistently in the Investa community ever since August 2020 and has been very active recently. 

A couple of weeks ago, our featured trader posted his technical analysis on $BDO, a hot stock in the local market and banking company led by the SM GROUP. $BDO was charted by @marketpainterph predicting that $BDO was bound for a breakout.

As the stock recently retested at around 110, @marketpainterph charted its support, volume,  resistance, trendline, and RSI on the chart. @marketpainterph felt an opportunity to have a good entry near the 1st wave at 110-112 area.

TECHNICALS OF THE TRADE

Technically, $BDO bottomed at 110 are which was also nears  its 52-wk low. After following the elliot wave prediction, it seems that the stock breakout at the 114-ish area, volume was still strong as BDO is one of the leader in the local stock market. BDO will now have to face resistances at the 130 and 135 levels as it tries to continue its uptrend. BDO is showing strength in terms of RSI, Volume, MA, and Net Foreign Buying (NFB). As per the prediction of the featured trader, it will consolidate first and retest before breaking out to 135+ level.

FUNDAMENTALS
BDO is led by the SY GROUP, a prominent family in the country and a diversified holdings firm focused on real estate, telecom service, banking, malls, and others. As such, the stock is heavily affected by how the financial market moves. Although interest rates remain high, the main driver for the stock right now seems to be the overall bullishness of the market as a whole. Given that BDO is the biggest bank company locally, it has a market capitalization of 559 Billion PHP. This stock is driven by the support of its parent company and the diverse businesses and affiliated with SM group.

WHAT SHOULD BE MY NEXT MOVE

Should BDO start to consolidate, a good resistance to break could be 132 as a lot of supply currently resides near that area. Once broken we could see BDO continue its rally.

As the stock continues to move, it may be wise to wait for a better entry point before putting on a trade. As always, make sure to adhere to your systems and set-ups even if the market is bullish. 

Once again, KUDOS to @marketpainterph for being this week’s featured trader! Enjoy your 14-day InvestaPrime Access and continue to be an inspiration to the trading community.


Invest to build a better future and learn continuously to improve yourself.

Join our #InvestorDay 9.9 and get a chance to win LIFETIME ACCESS to our InvestaFest premium recorded videos and have the opportunity to learn straight from top traders, entrepreneurs, industry leaders in the country!

To join, simply:
1. Download Investa app
2. Complete application
3. Invest for as low as Php 1,000.00 to claim your 150 raffle tickets

You can invest as much as you want on or before September 9 and claim unlimited raffle tickets!

Invest today: http://invs.st/IVGWInvestorDay99Daily

Subscribe to our Newsletter

Join our mailing list for investing tips and stock market advice
to help you reach your first million.

You have Successfully Subscribed!