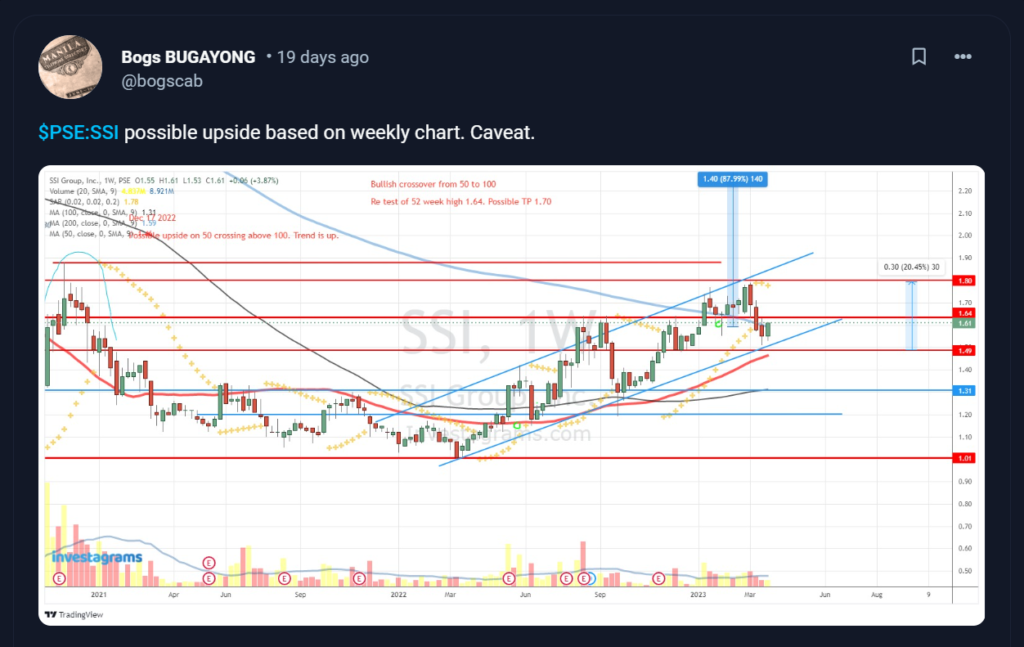
@bogscab, a.k.a. Bogs Bugayong, is spotlighted for this week’s featured trader! Spot how he used multiple indicators to execute a clean, well-informed trade set-up on $SSI.
Using multiple indicators in trade setups is important because it can provide a more comprehensive and accurate analysis of the market conditions, leading to more informed and profitable trading decisions.
Let’s take a look at how @bogscab utilized his indicators to his advantage.
ANALYSIS FROM @BOGSCAB

What can be seen from @bogscab’s set-up is how intricately he used the support and resistance (S/R), Moving Averages (MA), and the Parabolic Stop and Reverse (SAR) indicators. By carefully determining the direction of the trend and being supported by multiple confluences of his indicators, @bogscab was able to spot the potential surge in price in $SSI.
At the time of the post, $SSI was trading at the 1.61 level. The stock surged in price two weeks after, reaching a peak at the 2.30 level, for a potential increase of about 43%.
TECHNICALS OF THE TRADE
The indicators contributing highly to @bogscab’s trade setup are the Support and Resistance, Moving Averages, and Parabolic SAR.
In trading, the concepts of support and resistance are significant as they pertain to specific levels on a chart where an asset’s price may either stop or reverse its movement. @bogscab used S/R to determine the key trading levels of $SSI and take into account these levels as he executed his trade.
@bogscab also used multiple moving averages to provide a more comprehensive view of the price trends and momentum of $SSI. Using multiple moving averages can give traders a complete market picture and help them make more informed trading decisions.
Lastly, @bogscab used the Parabolic SAR to identify the direction of an asset’s momentum while providing potential buy and sell signals. Parabolic SAR determines the trend, possible entry and exit points, stop-loss placement, and potential trend reversals.
FUNDAMENTALS OF THE TRADE
The SSI Group Inc. ($SSI) recently reported its annual revenues for 2022. In the face of the challenges brought about by the COVID-19 pandemic, the company’s financial performance has exceeded expectations. Notably, the company’s net income for the year has reached an impressive ₱1.93 billion, representing a substantial increase of 136.7% compared to its pre-COVID net income of ₱815.5 million in 2019. This remarkable feat is a testament to the resilience and adaptability of the Group in navigating through unprecedented market conditions. Even in the fourth quarter alone, the Group’s net income has shown remarkable growth, recording a figure of ₱1.0 billion compared to ₱595.6 million in the same period last year.
WHAT SHOULD BE YOUR NEXT MOVE
$SSI is currently trading at the 2.16 level. Due to its recent surge in price, it is important to thoroughly evaluate the situation before making any investment decisions. This involves considering factors such as market conditions, company news and fundamentals, valuation, technical analysis, risks, and long-term potential. Investors can make informed decisions and avoid pitfalls by carefully considering these factors.
It is also essential to re-evaluate strategies and wait to confirm the trend’s direction to avoid potential pullbacks.
Once again, KUDOS to @bogscab for being this week’s featured trader! Enjoy your 14-day InvestaPrime Access and continue to be an inspiration to the trading community.
A TRADER’S JOURNEY: LEARNING AND ADAPTING
Catch Miguel Liboro, a seasoned fund manager from ATRAM, as he teaches us how to ELEVATE OUR GAME AS TRADERS
See you on April 28, from 7pm onwards!
