
If you haven’t noticed yet, Investagrams has a POWERFUL technical analysis indicator that can help you take the next level: the Volume Profile indicator. While other indicators often boast complex formulas, the volume profile is very simple. It shows you the volume of shares traded per price level. However, don’t let its simplicity fool you as this tool can be very useful. Let’s take a deeper dive into this indicator.
HOW DOES THE VOLUME PROFILE INDICATOR WORK?
As was mentioned, the volume profile shows you how many shares were traded per price level. By clicking the convenient button, you can have the indicator show up whenever you want. When used, information is displayed to you through a histogram as seen below.

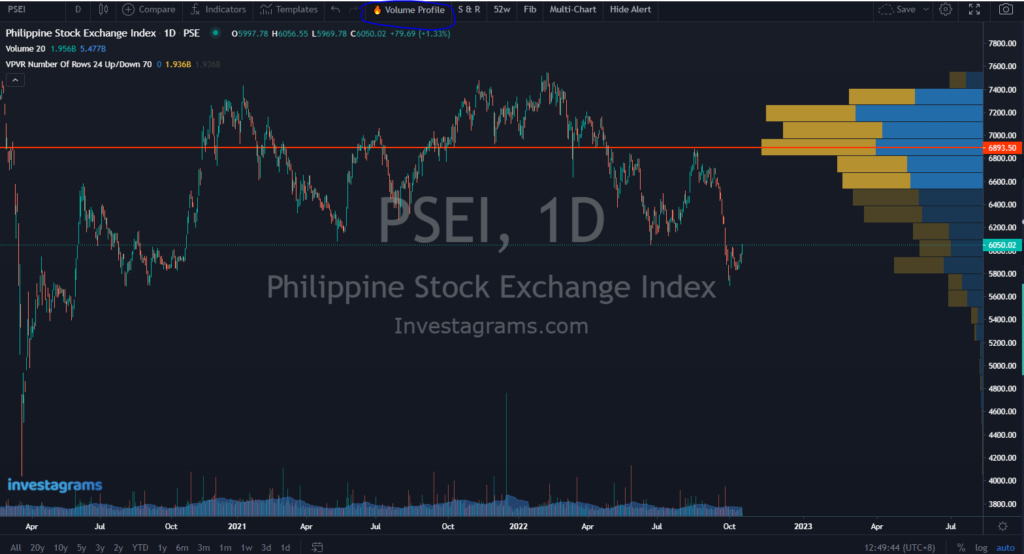
This indicator lets you see levels where buying and selling are more intense. Once you find out which levels encountered heavier buying/selling, you should know that these areas should serve as more prominent support and resistance levels. As a rule of thumb, prices often don’t have trouble going through areas with little activity. On the other hand, prices will often have trouble going straight past areas with a lot of traded volume.
WHAT DATES DOES THE INDICATOR USE?
What makes Investagrams’ volume profile indicator unique is that it can dynamically adjust the range it tries to profile. Generally, the indicator will calculate the volume per price on only what’s being shown.

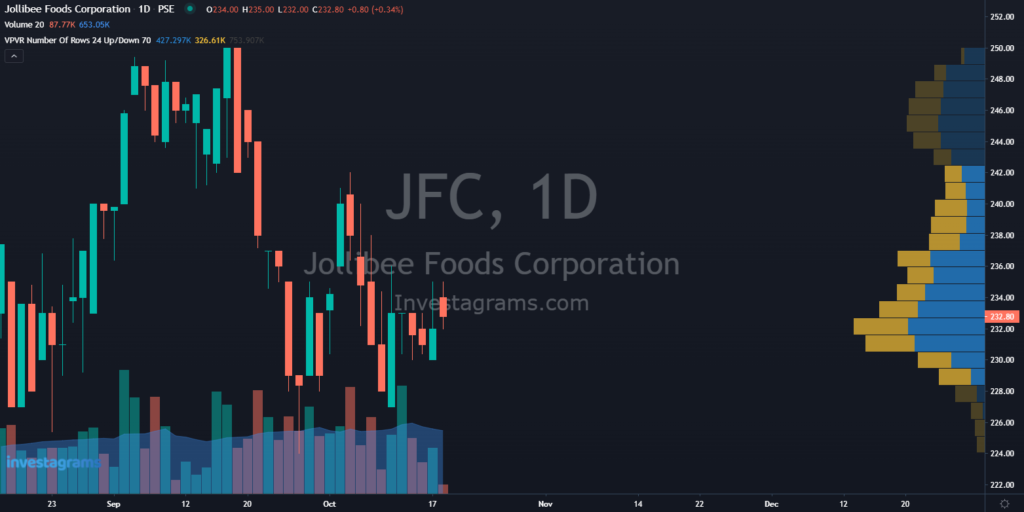
For example, here we can see that the chart only shows candlesticks up until August 16. Thus, the indicator will show you the volume by price for trading activity from that date until the current date.

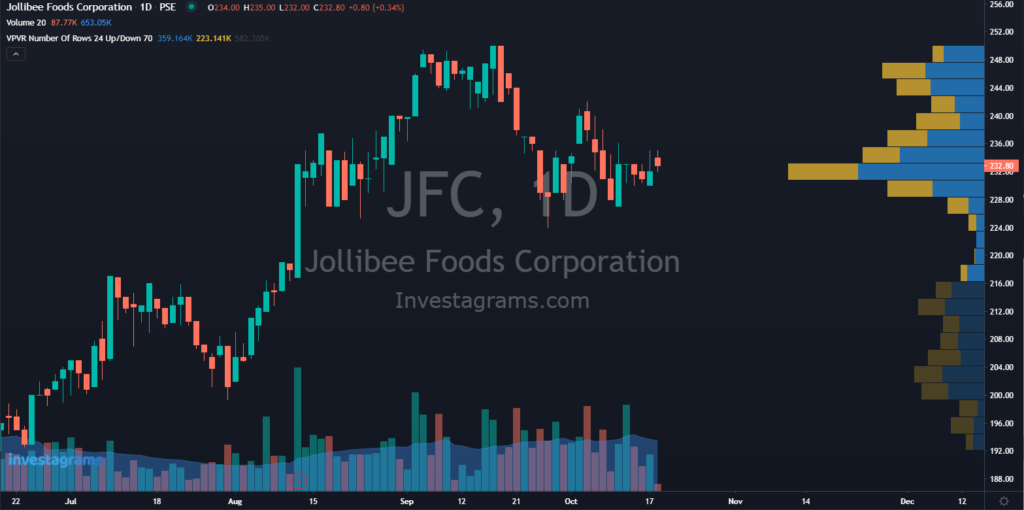
If you zoom out up until the June 20 candle, the indicator will adjust to that date. It will then show you the volume by price for trading activity from the new date until the current date.

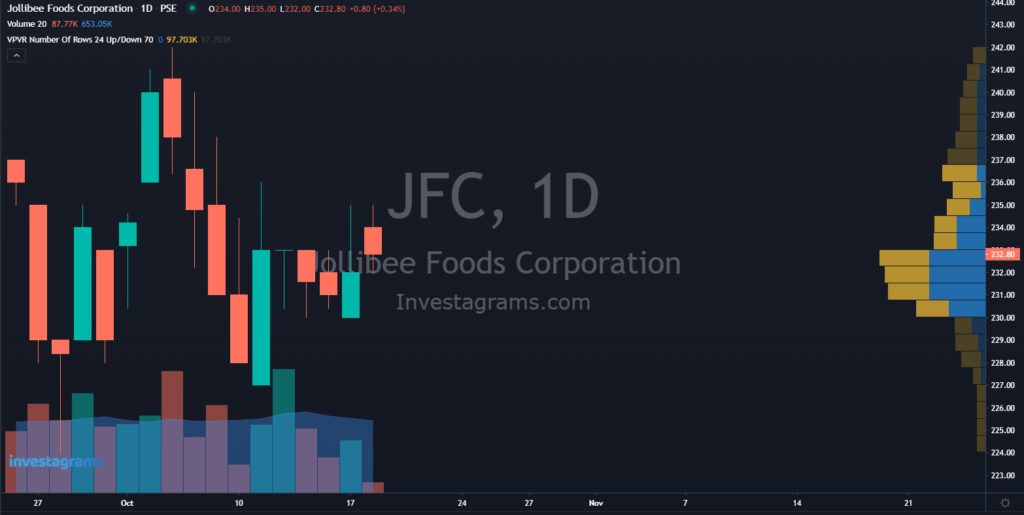
Same with zooming in, the indicator will always adjust accordingly depending on what’s shown in your chart.
USING VOLUME PROFILE TO THE FULLEST
Volume profile is often used in conjunction with other indicators and chart patterns. Through the volume profile, chances of success are amplified since you can identify which support and resistances are more important.
SAMPLE TRADE USING VOLUME PROFILE: $EMI
Let’s look at how volume profile can make even simple supports and resistances more effective to trade with.

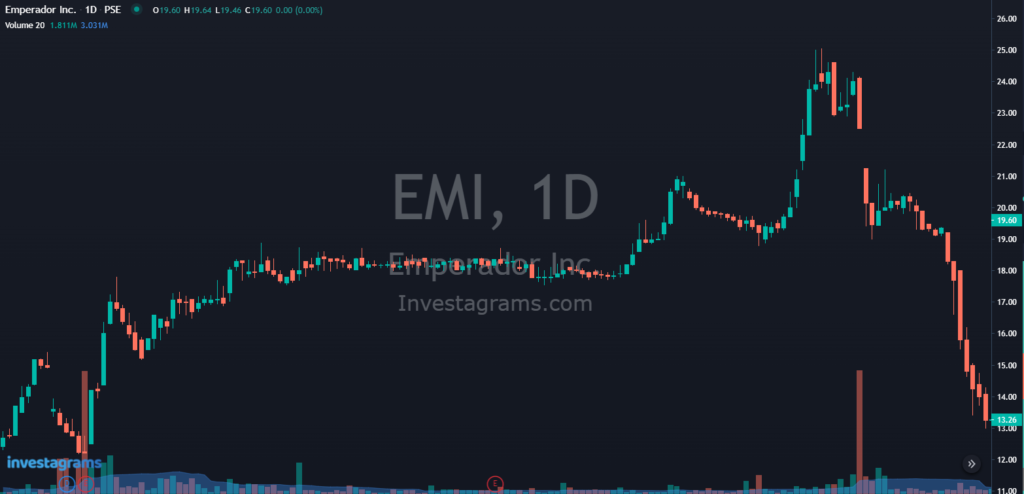
When the Philippine stock market index came falling, many stocks fell victim. Emperador was one of the stocks that were heavily affected by the market sell-downs. However, as always whenever big sell-downs occur you can expect to see at least a quick bounce play.

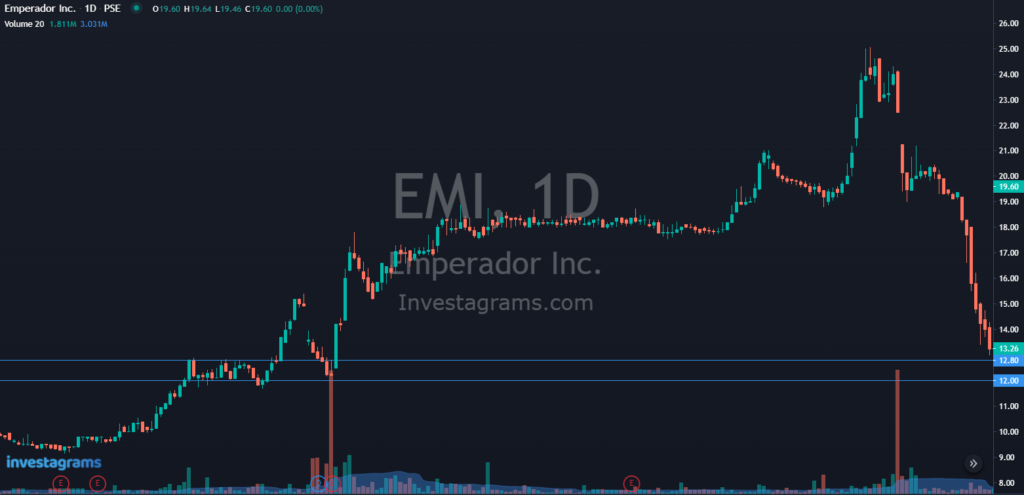
As you zoom out you start to see support levels that you can choose. But, which ones should you use as entries and cuts? And, which levels should serve as your targets? As you trade more and more, you’ll most likely encounter times wherein charts are confusing given that there are a lot of levels to choose from.

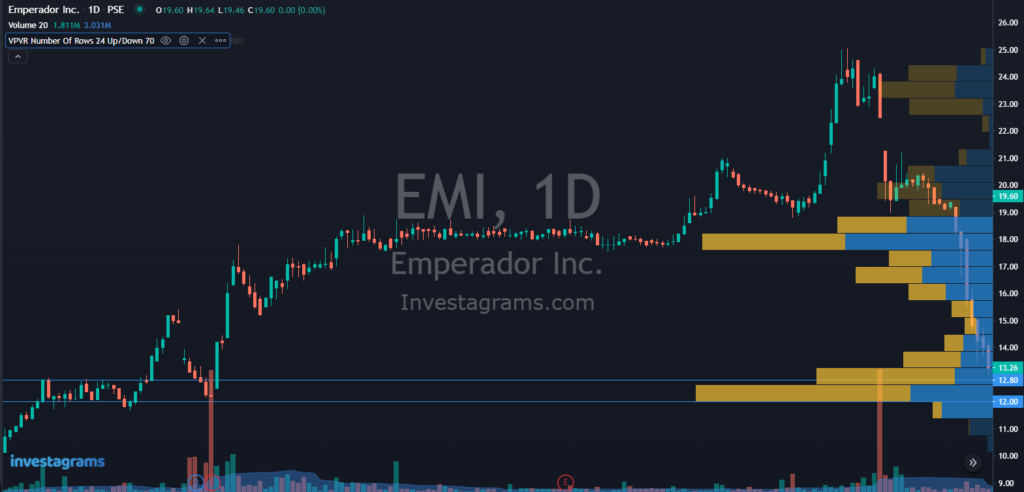
For the example of $EMI, the volume profile tells you that 12 – 12.8 was a major level for the stock. You would also see clearly that your biggest target would be around 17.5 since most of the volume traded was there. The initial smaller target would be around 16.6 as it would be the closer significant level. Although 15 could serve as a technical target too, the volume profile would show you that the market takes little interest at that price level.

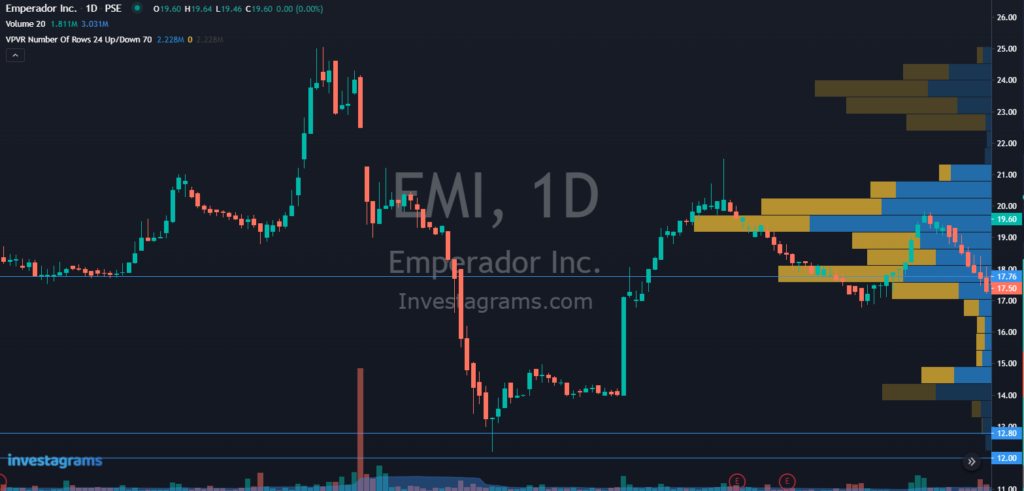
Prices would eventually break past 17.5, but selling at that level would still give you a 40% profit. Of course, using the volume profile won’t make your predictions correct all the time. However, it will most definitely help raise the probability of success.