
@amadeus024 takes the spotlight for this week’s featured trader as he shares his knowledge and insights on stocks from the PSEI.
In a quote by Naved Abdali, he says “Once you have a plan, always invest within the boundaries and parameters of your plan. Never bend your rules to accommodate your guts.”. The main benefit of technical analysis is that it aids investors and traders in forecasting market trends and making trading and investing decisions based on the study. Watch as @amadeus024 uses this to his advantage.
@amadeus024 gave his thoughts on FCG and the potential course it might go after completing the shark pattern harmonic about 11 days ago. Additionally, given the current status of the market, @amadeus024 was able to predict where the price might go.

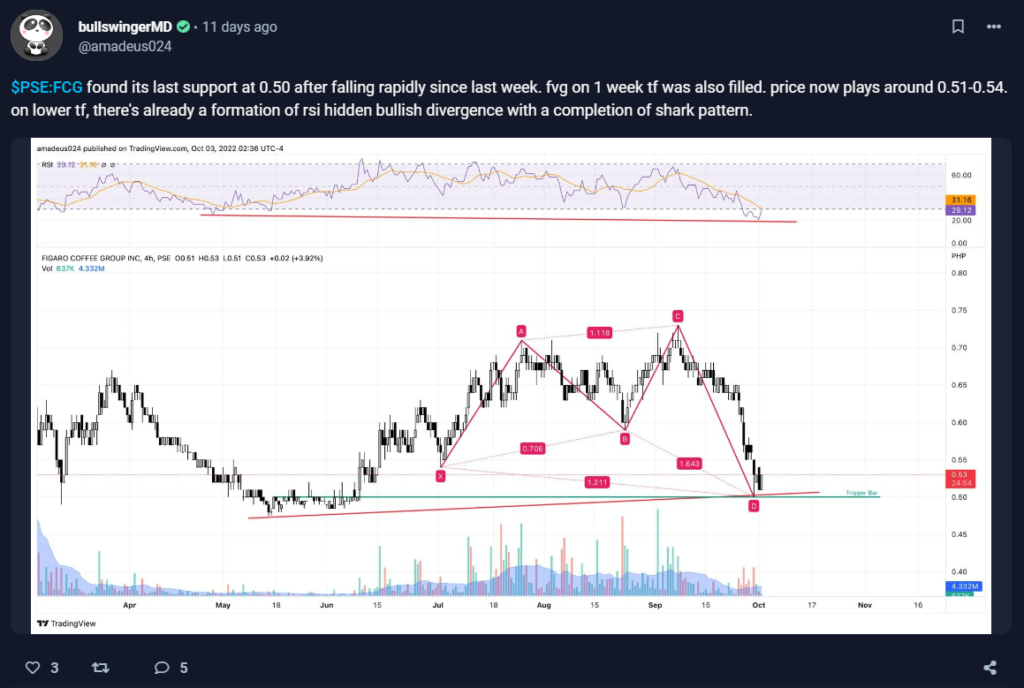
During this specific trading period, @amadeus024 has plotted out a simple support line in the 4-hour time frame. We can also see an RSI, a momentum indicator, in its oversold levels (below 30) which typically means a stock is undervalued. Moreover, it also means that it can be a perfect opportunity to buy. But what is most noticeable in the chart are the red lines that form M. This is what is referred to as a harmonic pattern, which aids traders in identifying pricing trends by projecting upcoming market movements. In order to spot possible price shifts or trend reversals, they use Fibonacci numbers to generate geometric price patterns.
TECHNICALS OF THE TRADE
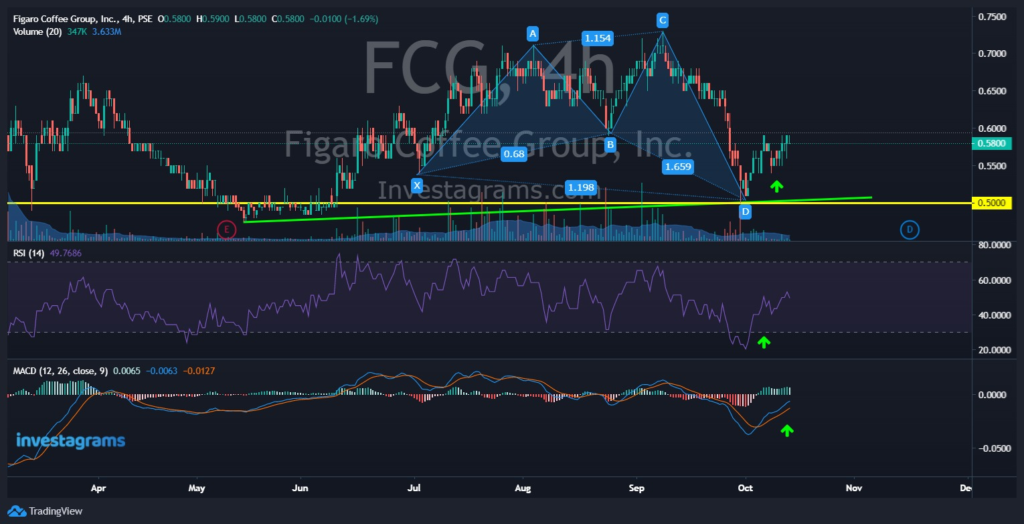
Technically, FCG at the time was gaining an uptrend momentum. First, let’s look at its RSI which is at its oversold levels (below 30). In most cases, traders would want to buy around that level as it typically means that the stock is very undervalued, allowing traders to buy the dip. Let us also take a look at the MACD, a trend momentum indicator, which has also crossed towards an uptrend movement. As for its support, the price has just managed to bounce at the 0.50 support level, allowing @amadeus024 to grab the opportunity to buy. Lastly, the formation of the Bullish Harmonic Shark Pattern. This pattern typically indicates an uptrend movement and combining our previous indicators, it is no wonder why @amadeus024 predicted the price to pump.

FUNDAMENTALS OF THE TRADE
Yesterday, October 13, Figaro Coffee announced that its overall first-half audited financial earnings were up by 80%. The firm achieved top-line sales of P2.43 billion, an increase of 80% from the same period last year, and a net income result of P198.2 million, an increase of 111% from the same period last year. Gross margins were reported to increase from 44% to 49% by utilizing economies of scale and cost efficiencies. As a result, it saw a 64% rise in operating income and a 13.5% return on equity. A P0.01936 per share first dividend, payable on November 21, 2022, was also declared. A total of 90 million pesos was allocated in all.
Source: PSE Edge
WHAT SHOULD BE MY NEXT MOVE
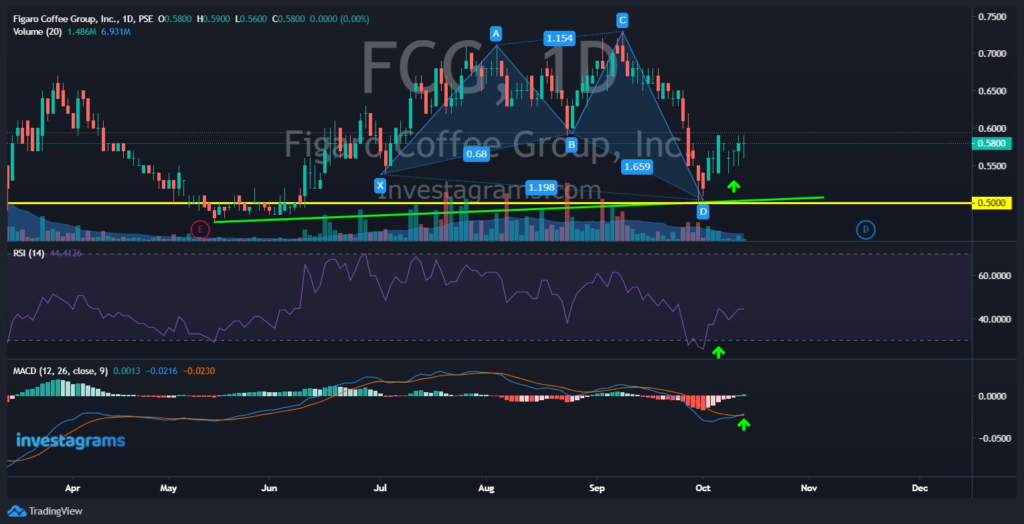
FCG looks to be doing well in the daily timeframe as all indicators show bullish momentum. Moreover, positive disclosures and sentiments about the company have just been released recently such as the declaration of cash dividends. An increase in revenue, gross margin, and net profit, not to mention the plans of expansion, are also one of the key factors which make this stock good in the long run.
With all this considered, it is best to allocate some cash to buy this stock and hold it for the long run.
Additionally, it would be advisable to buy the dips without spending too much of your funds under the current market condition. Always do due diligence and stay up to date on news that is pertinent to the stock you have selected.
Once again, KUDOS to @amadeus024 for being this week’s featured trader! Enjoy your 14-day InvestaPrime Access and continue to be an inspiration to the trading community.