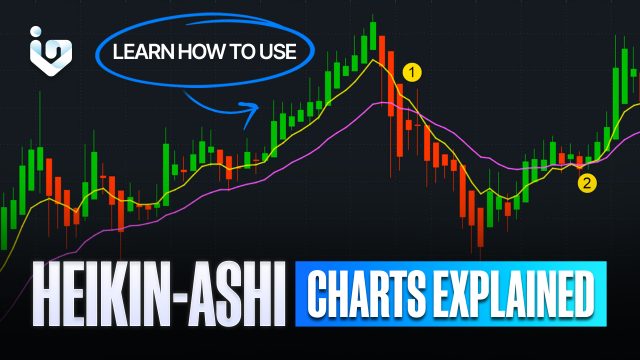
In the world of trading, clarity and precision are paramount. Heiken Ashi charts, a Japanese technique, offer just that. These charts are a variant of the traditional candlestick charts and are prized for their ability to filter market noise. Let’s embark on a journey to understand them and how they can be a trader’s ally in the tumultuous seas of the stock market.
The Genesis
The term ‘Heiken Ashi’ means ‘average bar’ in Japanese. Developed to provide a clearer picture of market trends, these charts use average price data to create a smoother visual representation. This smoothing process helps traders identify the strength of trends and potential reversals with greater ease.
Anatomy of Heiken Ashi Candles
Unlike traditional candlesticks, each Heiken Ashi candle is calculated using a combination of current and past price data. The formulas for these candles are as follows:
- Open: The midpoint of the previous candle (Open+Close)/2
- Close: The average of the current period’s Open, Close, High, and Low (O+C+H+L)/4
- High: The maximum of the current period’s High, or the current Open or Close
- Low: The minimum of the current period’s Low, or the current Open or Close
These calculations result in candles that reflect the average price movements, smoothing out erratic fluctuations.
Interpreting the Candles
Heiken Ashi charts are particularly useful for identifying market trends. A series of green candles, with no lower shadows, indicates a strong uptrend. Conversely, red candles with no upper shadows suggest a strong downtrend. Traders watch for changes in candle color and the appearance of shadows to anticipate trend reversals.
The Strengths of Heiken Ashi
The primary advantage of Heiken Ashi charts is their simplicity. They transform erratic price movements into a smoother line, making it easier to spot trends. This can be particularly helpful in volatile markets, where traditional candlestick patterns may be obscured by price gaps and extreme movements.
The Limitations
While Heiken Ashi charts are powerful, they are not without limitations. Because they are based on average prices, there can be a lag in the representation of price movements. This means that swift market reversals might not be immediately apparent. Traders must use these charts in conjunction with other indicators to confirm trends and reversals.
Heiken Ashi in Practice
To effectively use them charts, traders should integrate them into their existing trading strategy. They work well with momentum indicators like the Relative Strength Index (RSI) or Moving Average Convergence Divergence (MACD). By combining these tools, traders can validate the signals.
Conclusion
Heiken Ashi charts are a valuable tool for traders seeking to reduce market noise and gain a clearer view of trends. While they should not be used in isolation, when combined with other indicators, they can provide a robust framework for making informed trading decisions. As with any trading tool, practice and experience are key to mastering this kind of chart.
In the dynamic dance of the markets, Heiken Ashi charts serve as a guiding light, helping traders navigate through the fog of price volatility. Embrace the simplicity and clarity they offer, and you may find your trading moves to a more harmonious rhythm.

