Investors know the market’s volatility is beyond their control. But, there must be a way to monitor market trends to protect assets and investments. Among the technical indicators in Investagrams, the Keltner Channel is known for spotting potential market signals. Keltner Channels are volatility-based bands on either side of an asset’s price. Traders can also use this technical indicator to help determine a trend’s direction.
Let’s take a closer look at the Keltner Channel and how you can use it to your advantage.

What is the Keltner Channel indicator?
Chester Keltner created the Keltner Channel in the 1960s, similar to the Bollinger Bands indicator. The average true range (ATR), instead of the standard deviation, is used by the Keltner Channel to estimate channel width. The Keltner Channel adapts to the state of the market since the ATR is a measure of volatility.
Reading the Keltner Channel
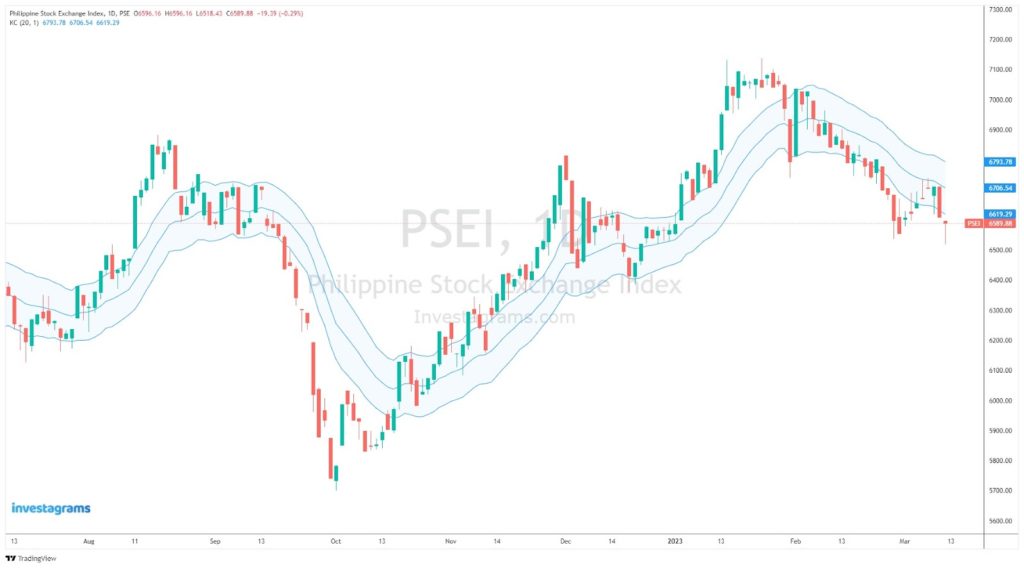
The Keltner Channel consists of three lines: a middle line, an upper band, and a lower band. The middle line shows the price’s exponential moving average (EMA). The top band is usually two times the ATR above the EMA. On the other hand, the lower band is two times the ATR below the EMA. The lines are multiplied by two because it is a typical multiplier value. The multiplier is a factor that determines the width of the channel. The bands expand and contract in response to volatility (as measured by ATR).
Here is a more detailed formula for how to calculate the Keltner Channel:
- Keltner Channel Middle Line = EMA
- Keltner Channel Upper Band = EMA + (2∗ATR)
- Keltner Channel Lower Band = EMA − (2∗ATR)
Traders use the Keltner Channel to detect potential buy and sell signals. When an asset’s price exceeds the upper band, it is termed overbought, and traders may search for a sell signal. When an asset’s price falls below the lower range, it is deemed oversold, and traders may seek a buy signal.
Traders may also use the Keltner Channel to determine an asset’s trend. An asset is said to be in an uptrend when its price is trading above the middle line. When the price falls below the center line, the market is said to be in a downtrend.
Other Keltner Channel methods
The usage of Keltner Channels can vary depending on the trader’s preferred settings. Keltner Channel’s settings can be adjusted to offer a range of applications for analyzing financial markets.
With a longer EMA, the indicator will have a more significant lag. This would mean that the Keltner Channel will respond slower to price movements. Shorter EMAs cause the bands to react faster to price movements. However, they make determining the real trend direction more difficult.
A greater ATR multiplier to produce the bands means a broader channel. Prices will strike the bands less frequently. A smaller multiplier means the bands will be closer together. This would mean the price will reach or exceed the bands more often.
On the other hand, some traders like to use a smaller ATR multiplier. Usually this will be used as an upgraded version of using the EMA as a trailing stop. By using keltner channels instead, stops can become more adaptable to the volatility of the markets.
Using the Keltner Channel

Let’s take a more practical look at how you could use the Keltner Channel as a trader.
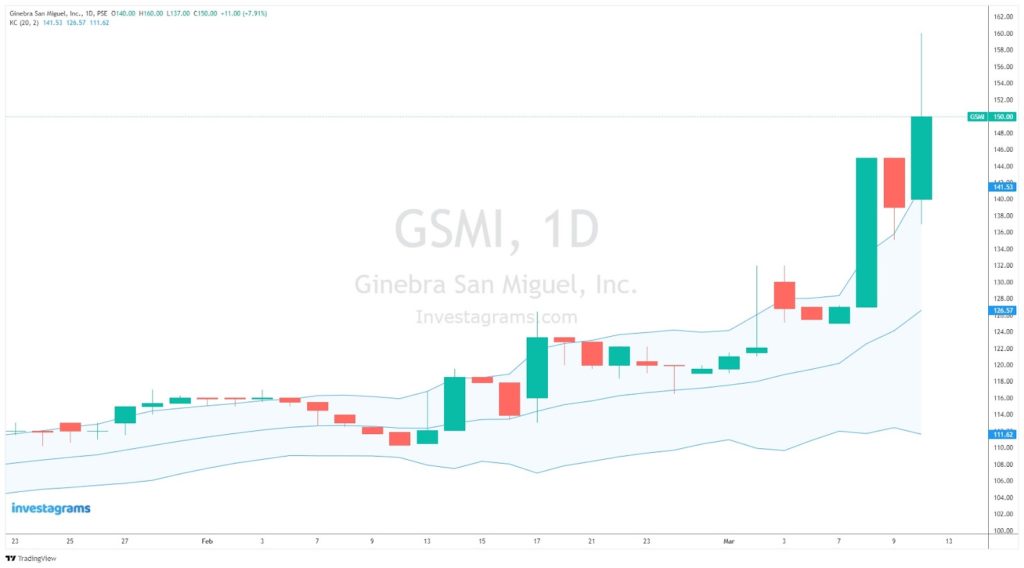
Using the standard multiplier of 2, here is how the Keltner Channel would look when used in $GSMI. First, let’s use the Keltner Channel to determine the trend’s direction. We can discern that an uptrend is in play because of the price move above the upper band. This shows price strength. This is in confluence with the channel angling upwards, which connotes that the channel and price are rising.
As for the buy signal, we can see that $GSMI has broken the upper band. If the price breaks through the upper band, it might indicate buying or going long on the security, as it could continue to increase. As for the sell signal, it is best to sell when the uptrend is losing momentum. This could be determined when the price finally reaches the lower band after a continual hit on the upper band. Traders could also buy when the price comes to the lower band and sell when it reaches the upper.
Nevertheless, false breakouts can occur. The price could momentarily break through the upper or lower band but immediately retraces within the channel. Before entering a trade, traders should validate the breakout signal with other indicators and research. Traders should also utilize adequate risk management tactics and stop-loss orders. This is to safeguard their holdings if the price swings against them.
Traders may use the upper and lower bands as support and resistance levels, as the price can oscillate between them. When the price reaches the lower band and starts to rise again, traders may see it as a buying opportunity. Conversely, traders may consider selling or shorting after the price reaches the upper band and starts to fall.
Last Remarks
To optimize the functionality of Keltner Channels, traders must select suitable settings based on their specific objectives. Do so in order to avoid the bands being too close or wide apart. This could also prevent the chances of rendering the Keltner Channel ineffective.
The Keltner Channel is a useful technical analysis tool, but it could be better. Traders should only depend partially on it to make trading choices. You should use it with other indicators and market analysis approaches to confirm trading signals. And as always, adequate risk management should also be practiced for long-term success.
