Every trader, beginner or expert, has seen these sticks with rectangles called candlesticks. In fact it has been a well-known symbol of the stock market but what makes it so important? Well, here are some reasons why candlesticks can be a possible strategy for trading.
Used in technical analysis, a candlestick is a type of price chart that displays the high, low, open and closing prices for a specific period. Originally from the Japanese, candlesticks are now being used by traders all around the world.
Candlestick charts are very visual, due to the color coding of the price bars and thick real bodies, which are better at highlighting the difference between the open and the close. Traders use these candlesticks to make trading decisions based on regularly occurring patterns that help forecast the short-term direction of the price.
Also, candlestick signals are used to analyze any and all periods of trading including daily or hourly cycles, even for minute-long cycles of the trading day.
Candlesticks are created by up and down movements in the price. While these price movements sometimes appear random, at other times they form patterns that traders use for analysis or trading purposes.
Patterns are separated into bullish and bearish. Bullish patterns indicate that the price is likely to rise while bearish patterns indicate that the price is likely to fall. A very important note is that no pattern works all the time since candlestick patterns represent tendencies in price movement.
Some notable and more reliable candlestick patterns include:
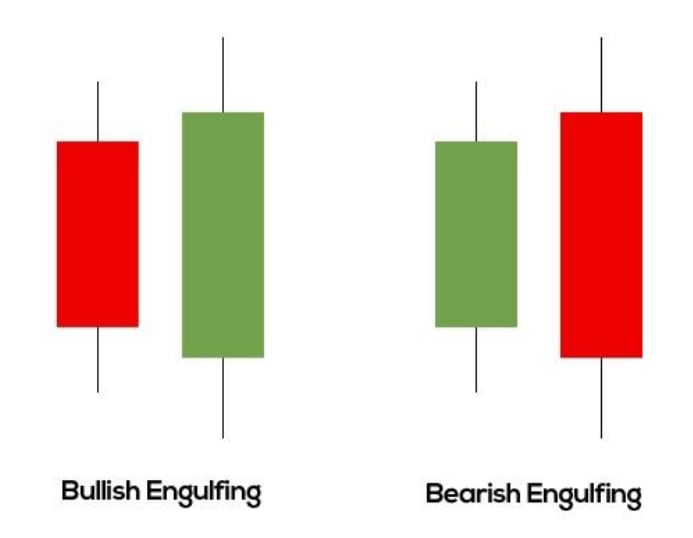
The Bullish and Bearish Engulfing Pattern

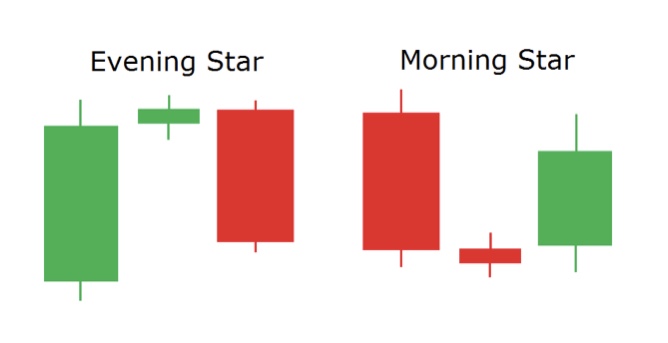
The Bullish Morning Star and Bearish Evening Star

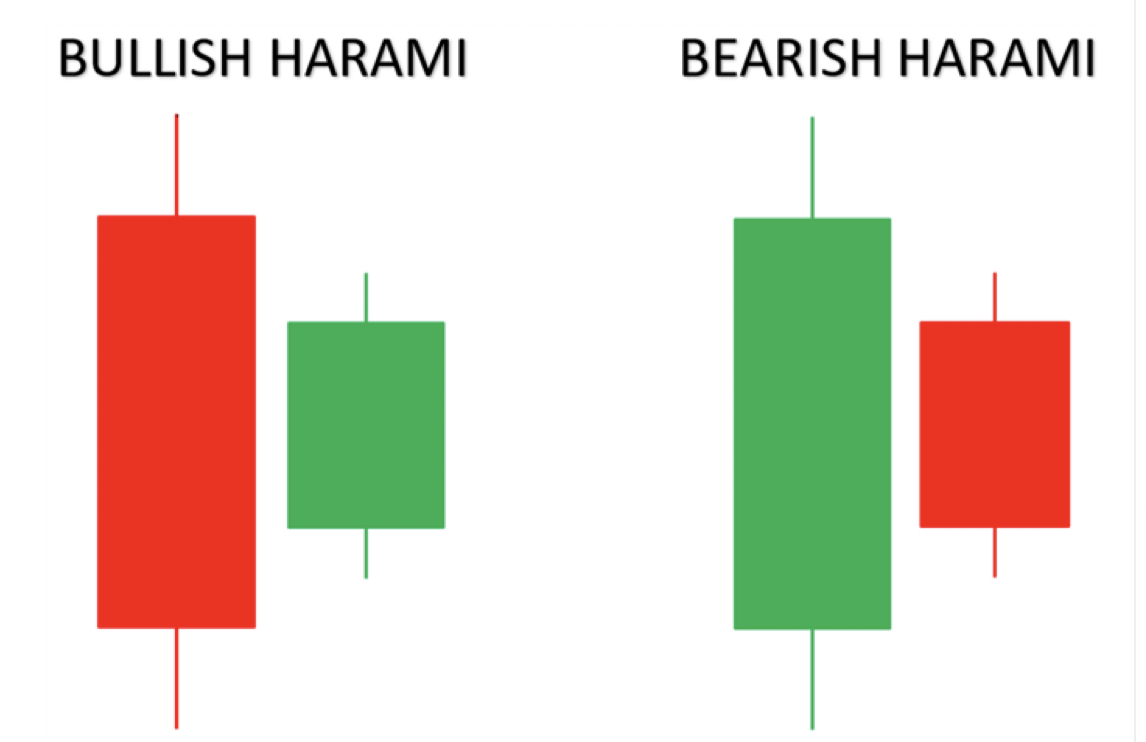
The Bullish and Bearish Harami

Candlesticks are a great indicator and a suitable technique for trading any liquid financial asset such as stocks and foreign exchanges. Reading and understanding candlestick patterns can help traders in making better and more calculated predictions about where an asset might be headed and can also use it as a factor in buying that asset.
Want to know more about the Stock Market and Technical Analysis? Check this free lesson from #InvestaUniversity:
