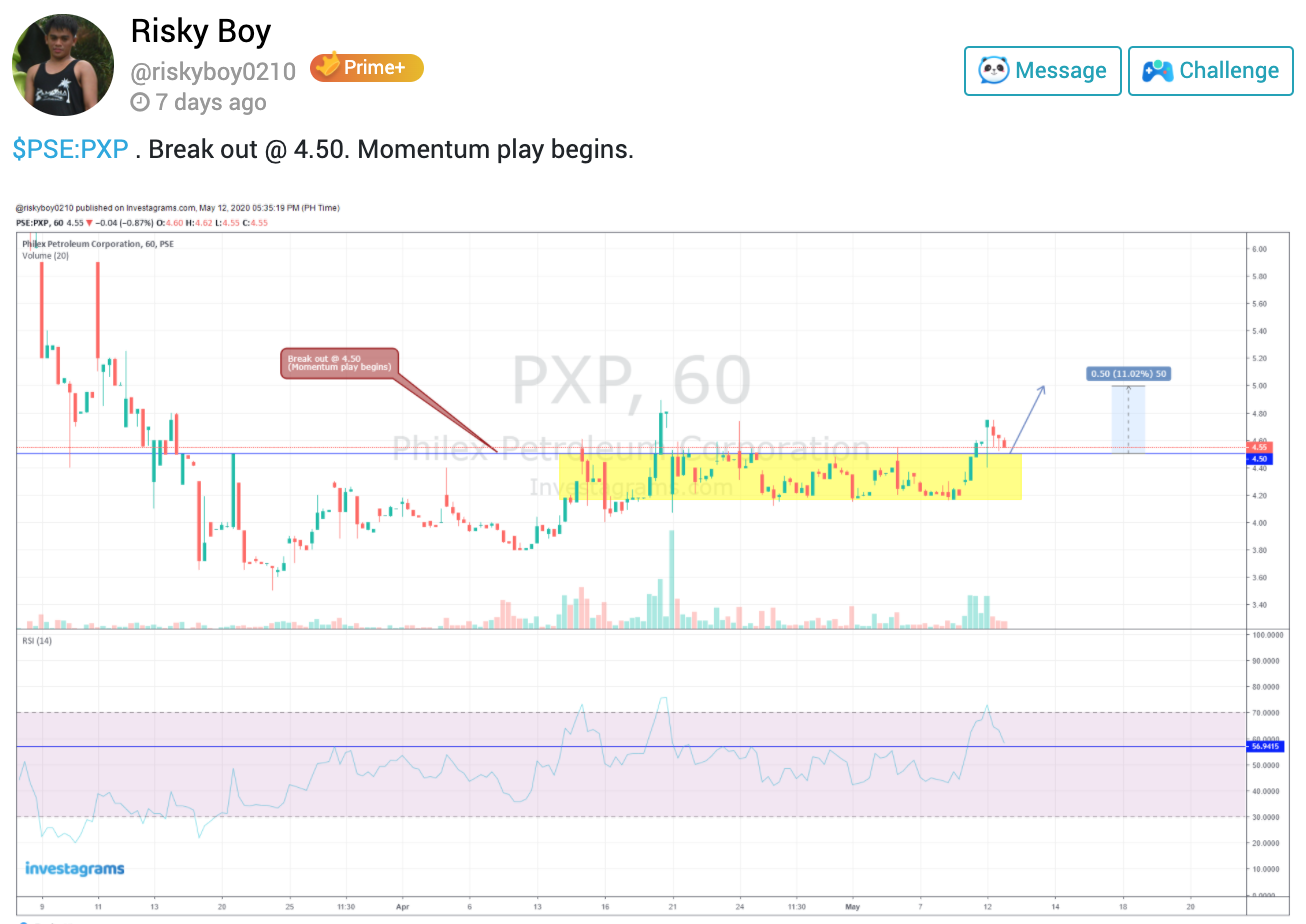
Congratulations to Risky Boy a.k.a. @riskyboy0210 for spotting $PXP (Philex Petroleum Corporation) 7 days before it strongly broke out higher! This trader saw that momentum was starting to build-up and that there could be potential for an impulse move. Based on his chart, he used RSI levels and simple support and resistance to aid in his analysis.
See his technical analysis last May 12, 2020 here: https://www.investagrams.com/Post/riskyboy0210/1026383

On Technicals
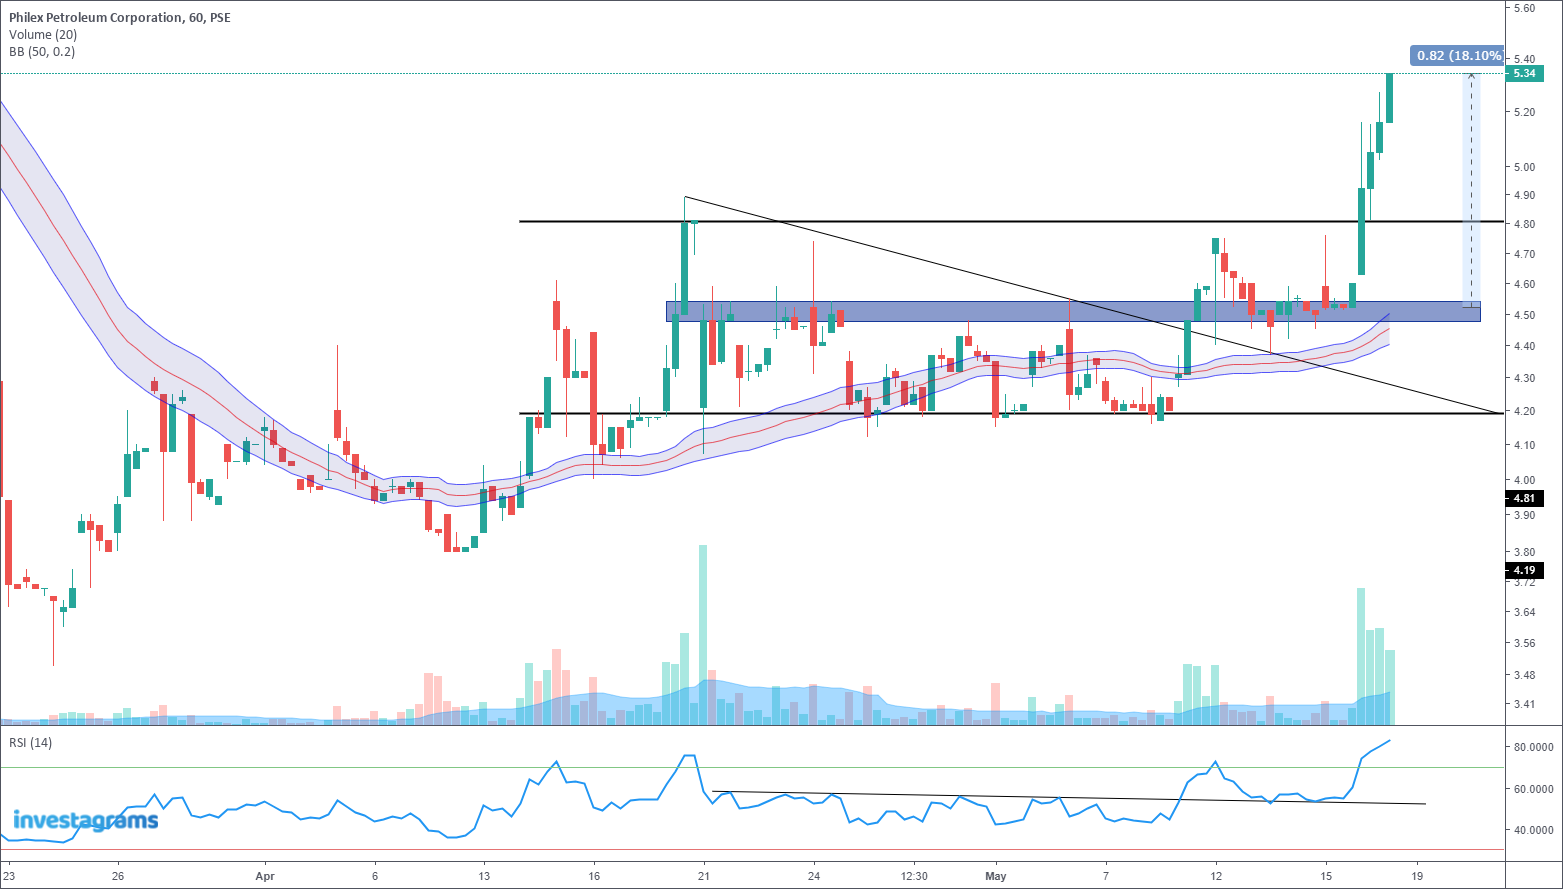
On the daily timeframe, it can be seen that $PXP was forming a higher low with a good amount of volume coming from the bottom. As the stock moved sideways, volatility started to drop. Resistance could be pegged at around the 4.6-4.8 area.

However, by looking at the intraday chart just as @riskyboy0210 did, it can be seen that 4.5 could be a key level to break as selling pressure seems to have moved there especially with volatility gradually decreasing. As the level is broken with good volume, the bullish scenario starts to play out as the 4.5 resistance turns into a support. Just like he said, the break of 4.5 was the start of the momentum play. For those who aren’t familiar, good build-up for bullish momentum often consists of decreased volume and volatility that are coupled with good volume on the breakout and higher lows.
Something else that was used to aid in spotting momentum was the use of the RSI as a breakout indicator. By looking for RSI to make a new high, it can be seen whether or not the breakout was a clean strong move or a choppy one that could be seen as a sign of weakness. To know further about RSI or the Relative Strength Index, you may visit our InvestaDaily article here: A comprehensive guide on how to use the Relative Strength Index (RSI)
Again, we would like to congratulate @riskyboy0210 for being our featured trader for the week (your access to FREE one-month InvestaPrime+ is on its way!) and of course, for snatching a good trade! Happy trading, and always remember to TAYOR!
