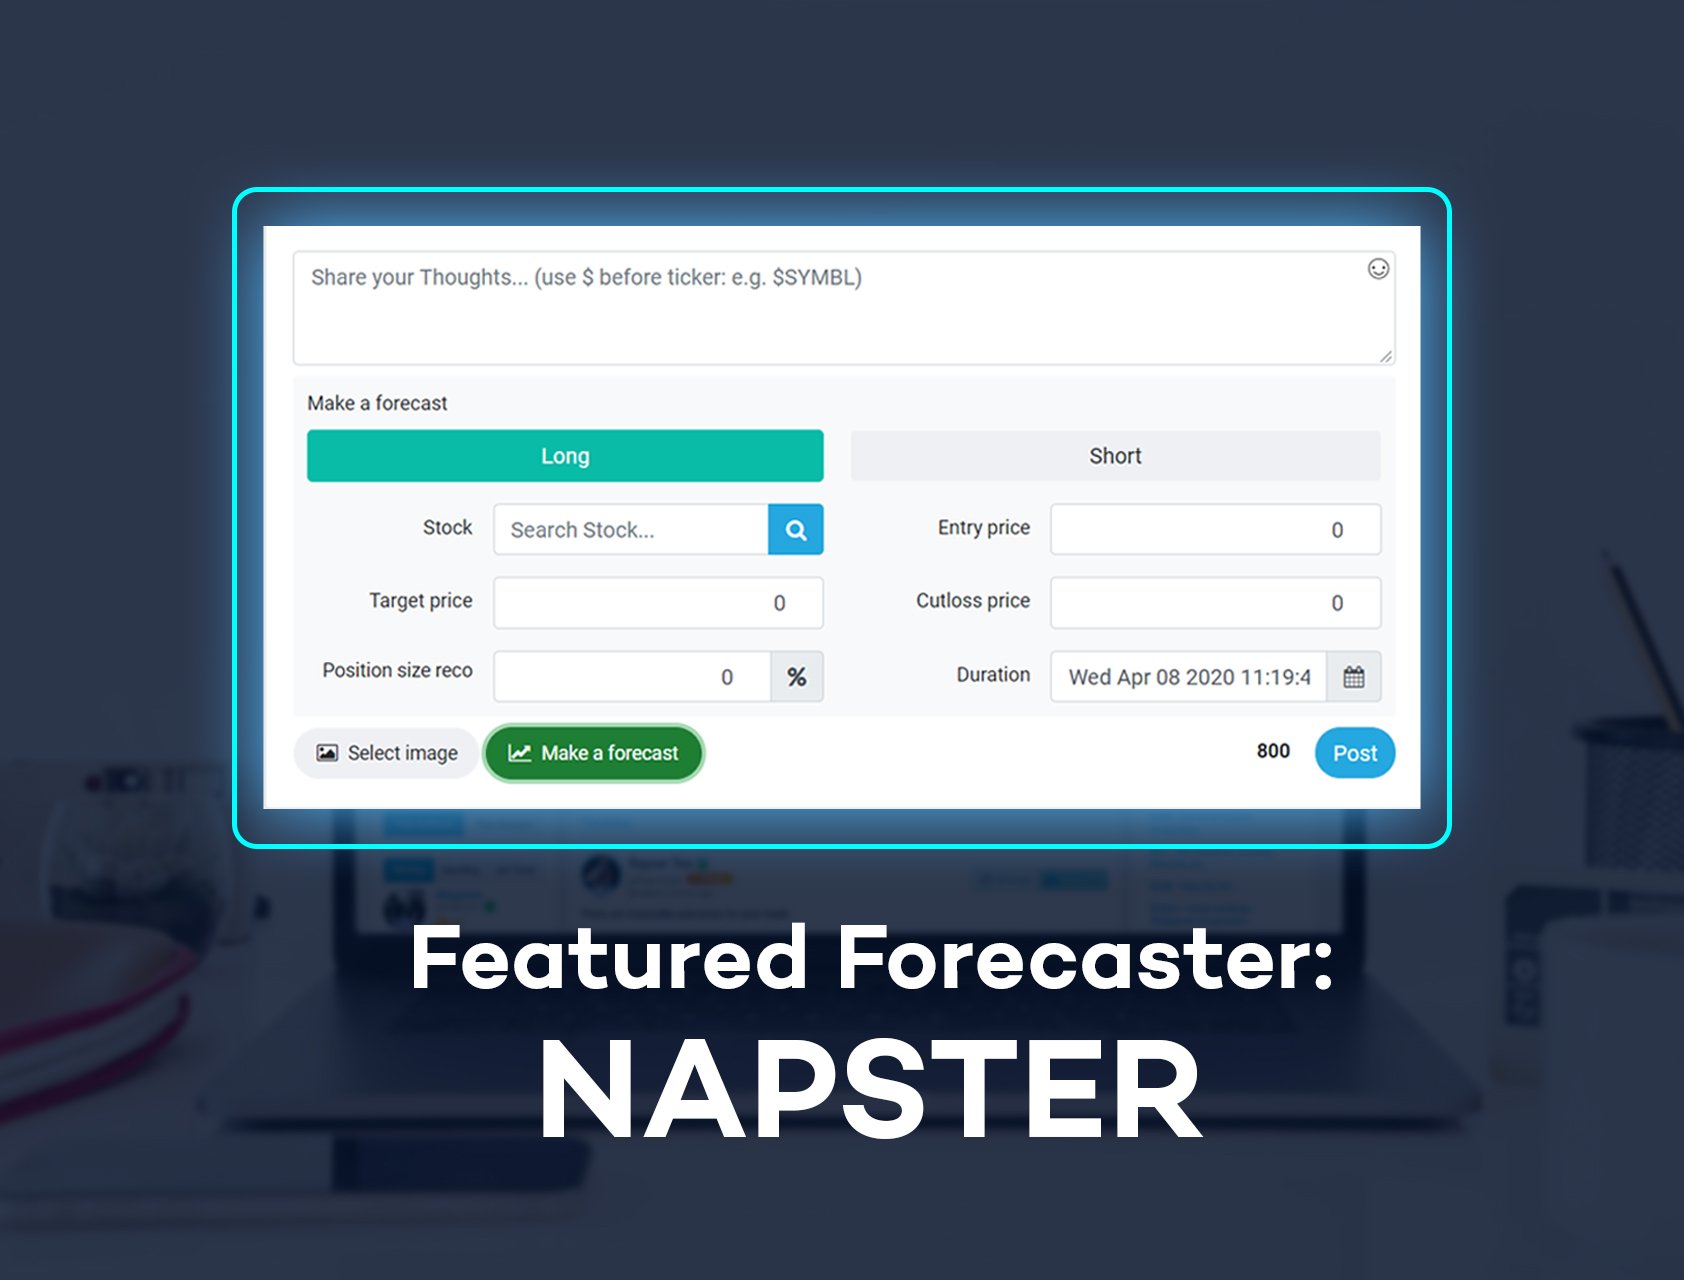
When Investagrams was just starting out, the social feed was full of analyses of countless traders on different charts. But through the years, our social network aspect of the platform has been an avenue for traders and investors of all levels to share their thoughts, inputs, and analysis on different stocks and recently on different asset classes like Cryptocurrency and Forex.
As we continuously find ways to further improve the platform, our team is also looking on how we can improve the social networking side of the platform. Seeing that majority of the users share their thoughts on different stocks, we believed that a great way to further develop the social feed was to track the analyses posted to see if it would have actually yielded a profit, and at the same time tracking the trade statistics of their posts.
This is why we developed the Investa Forecast.
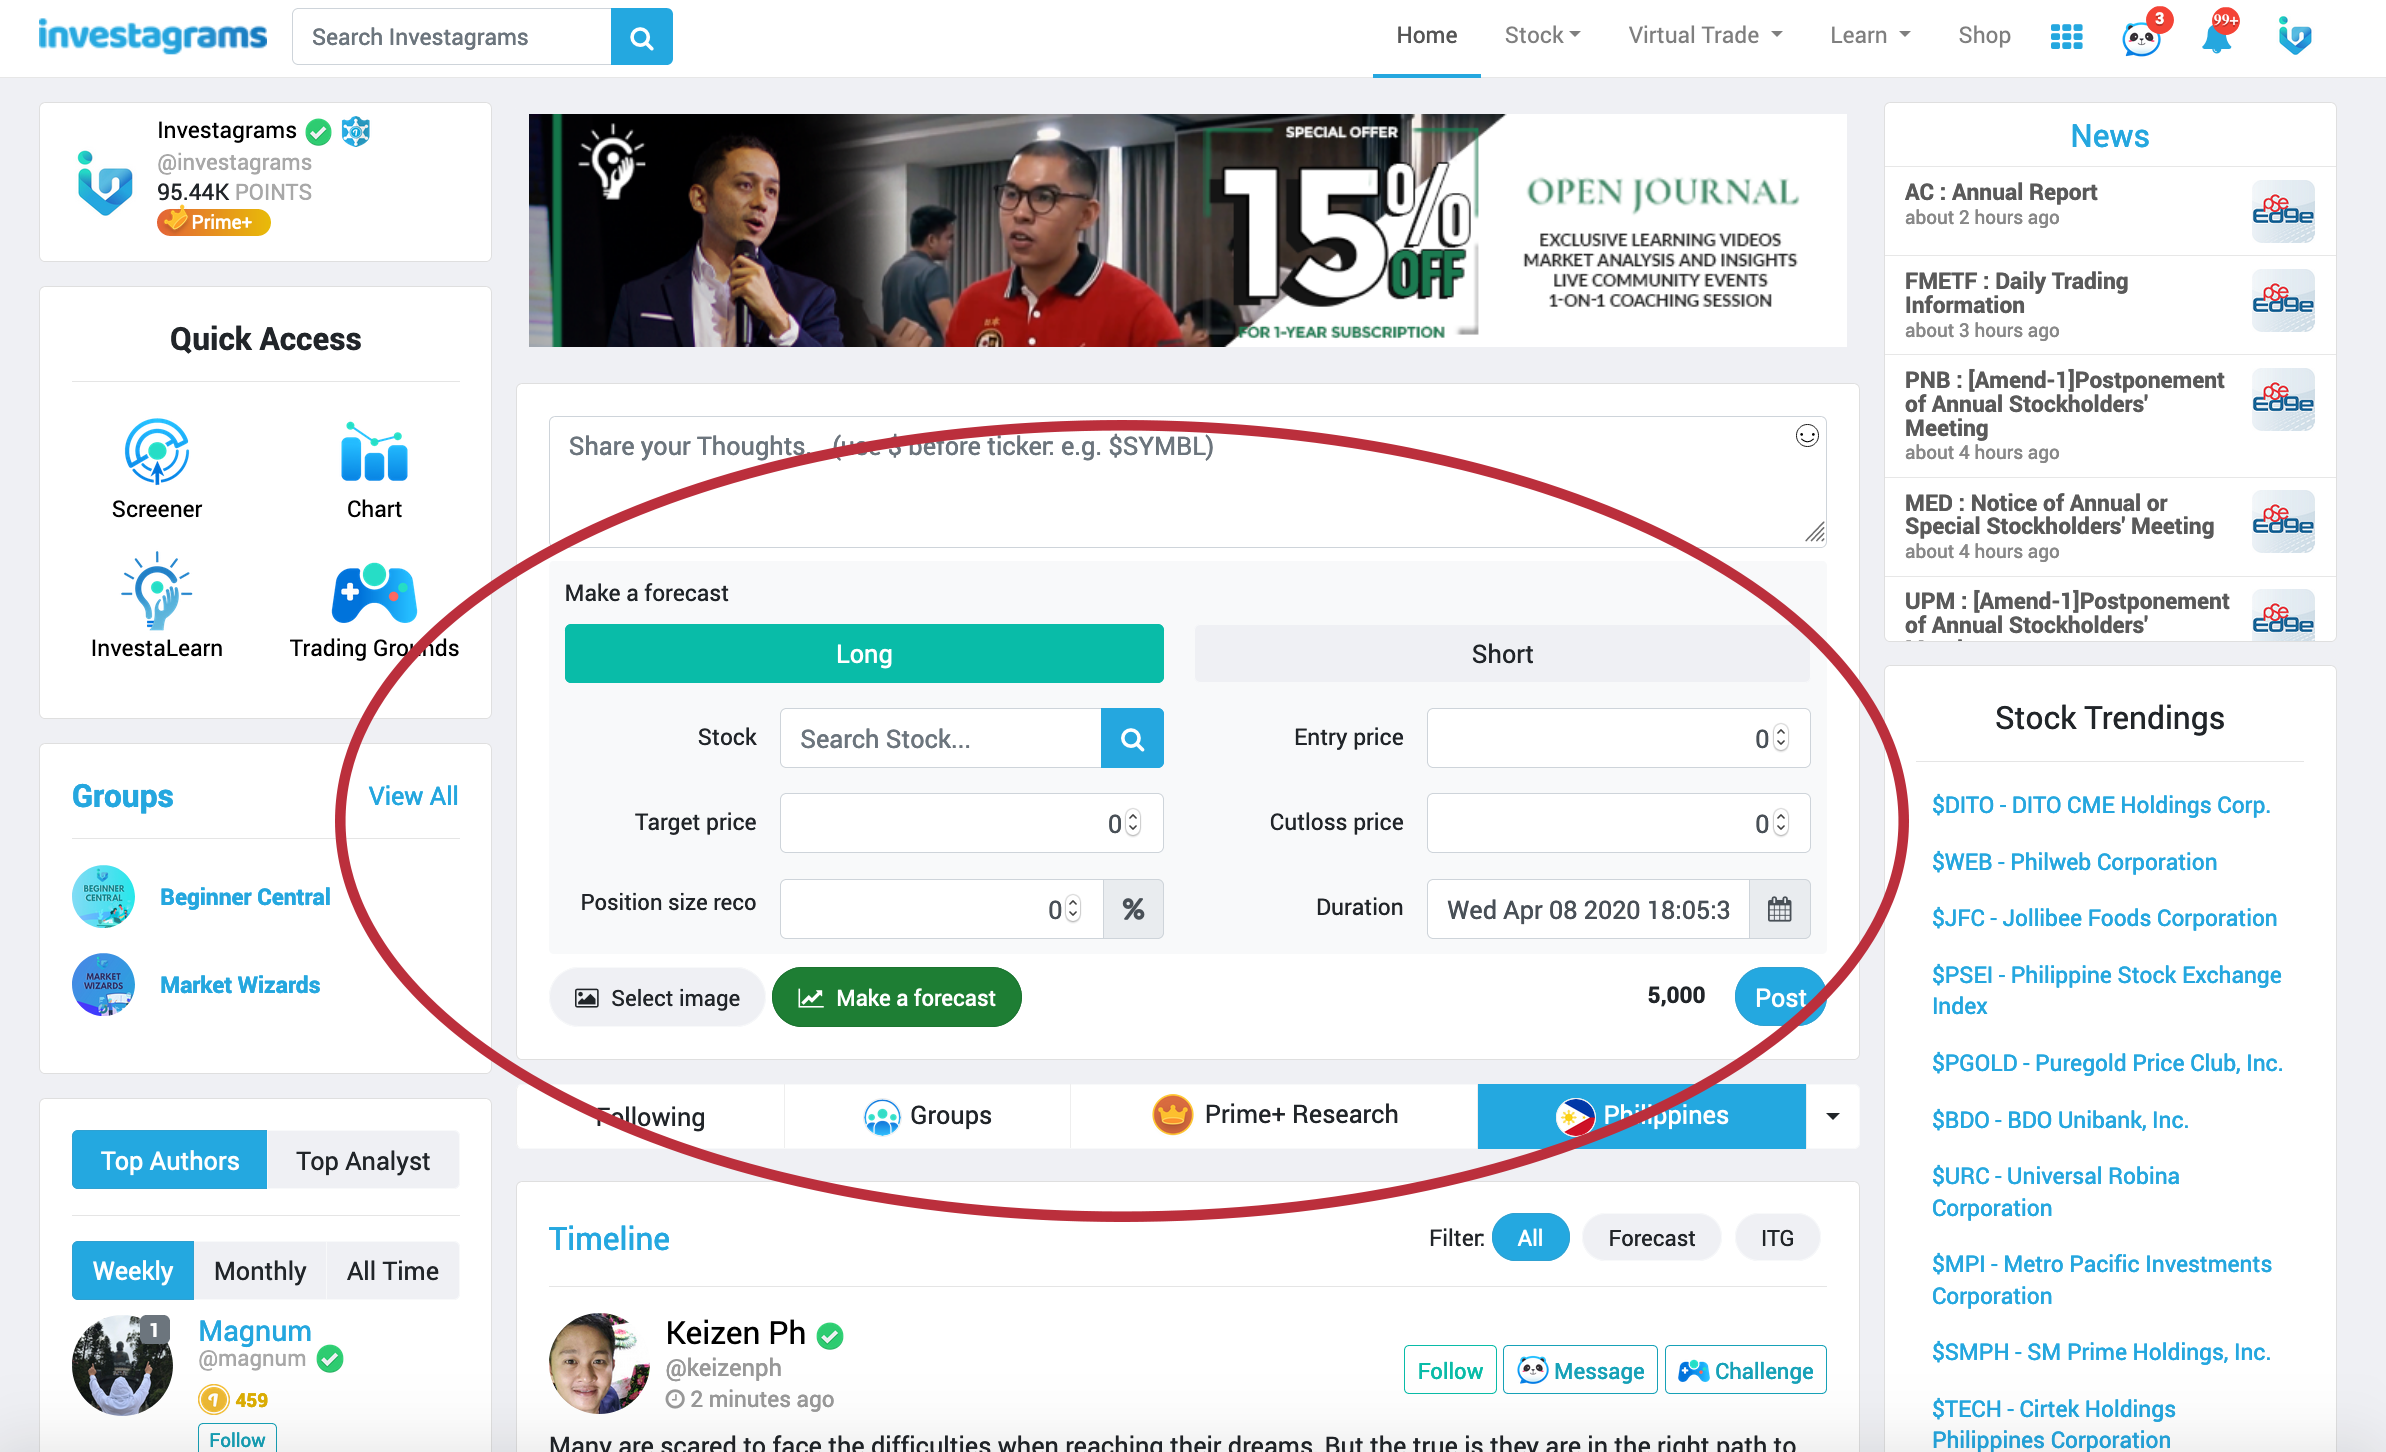
All you have to do is to input which stock you would like to forecast, the entry price, cutloss, target profit, and recommended position size. Then select the duration of the forecast; if you’re seeing only a short swing on a specific stock the duration can be as short as a few days, and if you’re seeing a medium-term swing then you can set it to a few weeks or months. You can also choose between putting on a long or a short position.
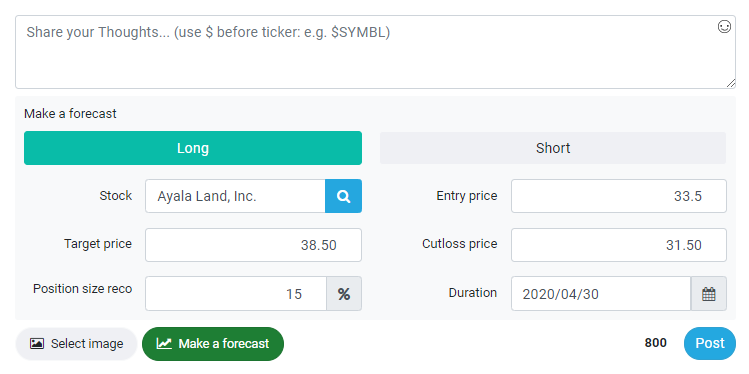
In this example, we forecasted that $ALI would potentially reach our target price of 38.50 by the end of April 2020. The entry price is 33.50 with a stop placed at 31.50, with a recommended position size of 15% of the portfolio. To further explain the forecast, you can add more insights on top for everyone to see.
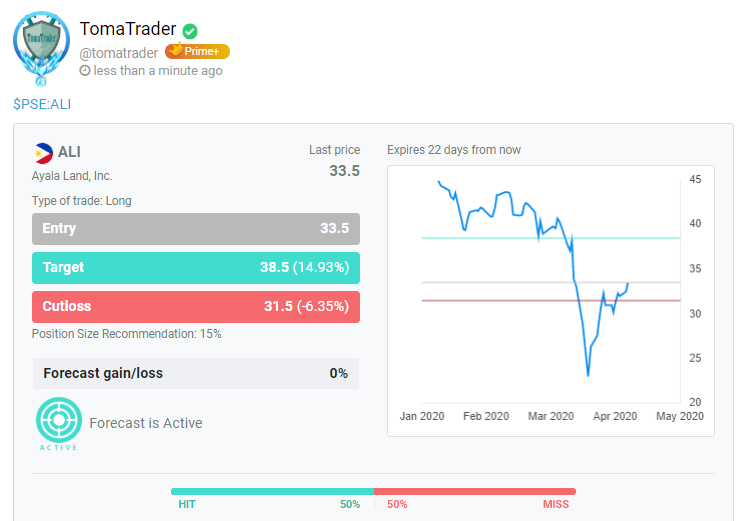
Once you’re done inputting all the necessary information, simply click ‘POST’ then this is what will be seen on the social feed. Now the other people in the community can also vote if they agree with your forecast, all they need to do is click ‘HIT’ if they agree and ‘MISS’ if they disagree.

Then once you’ve done a good amount of forecasts, you can see your statistics on your profile. You will know your average win/loss percentage, net profit, and hit rate. So aside from your own actual trading, knowing your forecast statistics is also a good way of identifying if your strategy is working well in the current market environment. You can also check the forecast statistics of other traders in the community (see example above).
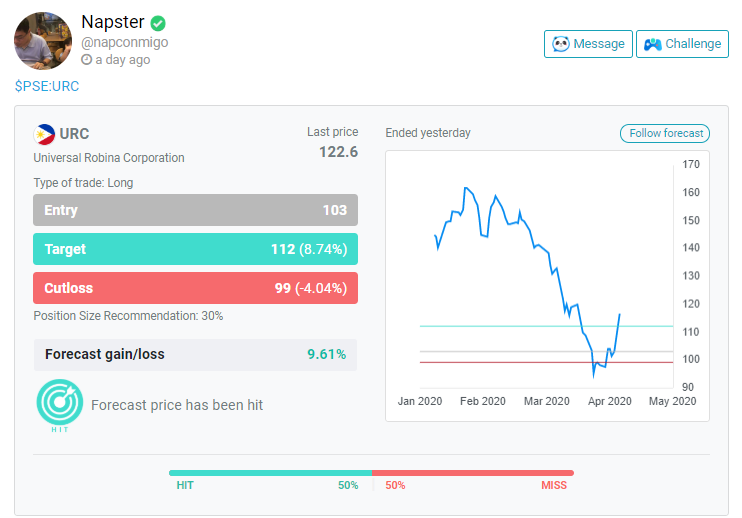
For our first featured forecaster, we like to give a huge shoutout to Napster a.k.a. @napconmigo who has been actively using the forecast feature this past couple of weeks. One of his recent forecasts was a success in $URC, which yielded him an 8.74% gain, and the stock is still continuing to go up. This was definitely a great spot as $URC has gone up nearly 50% since the $PSEi hit near 4,000 levels.
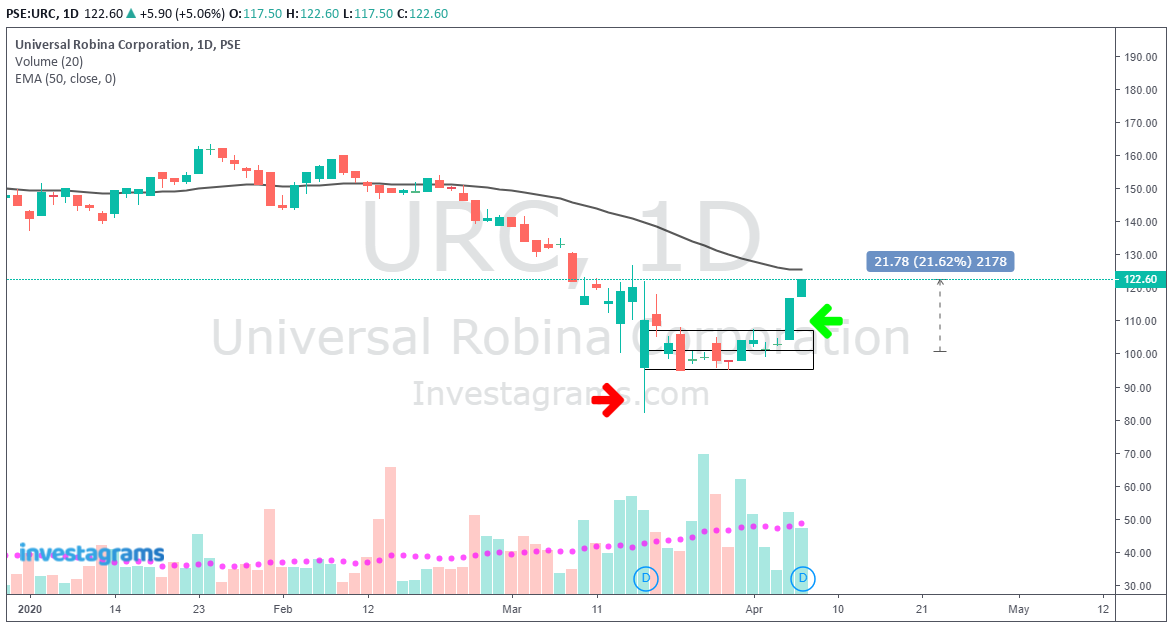
Bluechips have definitely been the stocks to focus on these past two weeks. After bouncing for falling close to 80 pesos per share, $URC created a consolidation pattern which showed two potential entries. If you position yourself during the consolidation at around 100 pesos, you would’ve been up 21% by today. If you waited for the confirmation of the breakout, you would be up more than 10%.
Again, kudos to Napster a.k.a. @napconmigo for successfully forecasting the short term movement of $URC and for consistently using the Investa Forecast feature. As a reward, we will be crediting 100 Php to your InvestaWallet. For those who would like to be our next Featured Forecasters, simply use the Investa Forecast consistently and keep an eye on your forecast stats.
